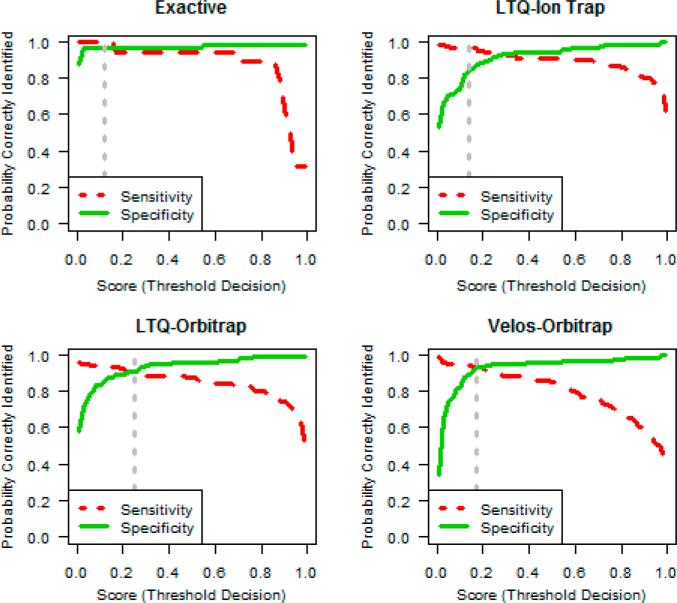
Figure 2.
Sensitivity and specificity trade-off. The 1150 curated data sets are shown according to their classification from the cross-validation results. Data are separated by instrument class and run through their separate classifier models. We define sensitivity as the probability of correctly classifying an out of control (or poor) data set, equal to 1 minus the false negative rate. Specificity is the proportion of good data sets that are correctly classified and is equal to 1 minus the false positive rate (see Experimental Procedures). The dotted vertical line indicates the optimal threshold, τ, which balances the cost of a false positive or false negative classification error.

