Figure 2.
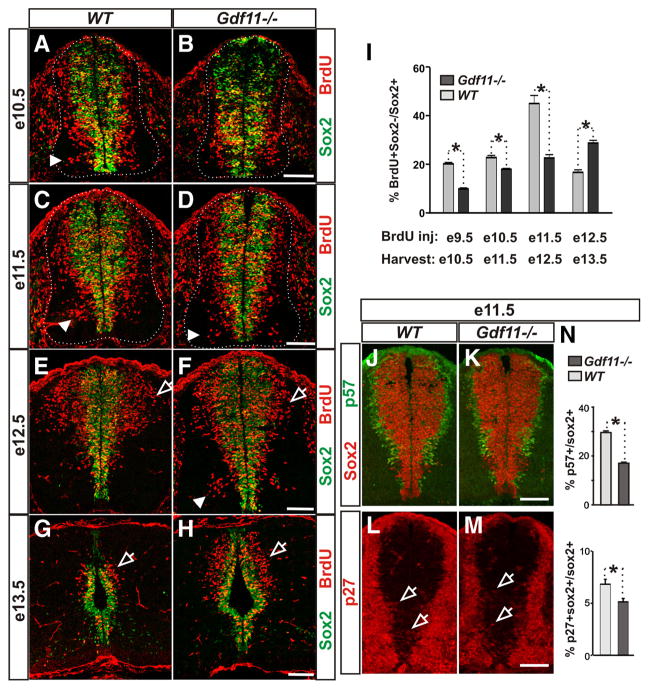
Gdf11 facilitates cell cycle exit and neuronal differentiation. A–H, Sox2 and BrdU staining of cross-sectioned brachial level spinal cords from embryos labeled with BrdU for 24 h before harvesting at e10.5 (A, B), e11.5 (C, D), e12.5 (E, F ), and e13.5 (G, H ). Brdu+ Sox2− cells represent S-phase progenitors at the time of BrdU labeling that differentiated during the 24 h chase. White dotted lines delineate the margin of the spinal cord. Arrowheads point to neurons generated in the ventral spinal cord (compare A with D and C with F ). Open arrows indicate neurons generated in the dorsal spinal cord. I, The percentage of BrdU+ Sox2−/Sox2+ cells in Gdf11−/− and WT littermates injected with BrdU at e9.5–e12.5 and harvested 24 h later. A slower and prolonged neuronal differentiation is observed in the Gdf11−/− embryos. *p <0.05. J–M, p57 kip2 and Sox2 staining (J, K ) and p27 kip1 and Sox2 staining (L, M ) of cross-sectioned brachial level spinal cord obtained from e11.5 WT and Gdf11−/− embryos. Open arrows point to p27+ Sox2+ cells (Sox2 signal is removed for easier visualization of the faint p27 staining). N, Percentage of progenitors that are exiting the cell cycle (p57+/Sox2+ and p27+ Sox2+/Sox2+) in e11.5 embryos. Higher p57+/Sox2+ and p27+ Sox2+/Sox2+ ratios were observed in WT compared to Gdf11−/− embryos. *p <0.05. Scale bars, 100 μm.

