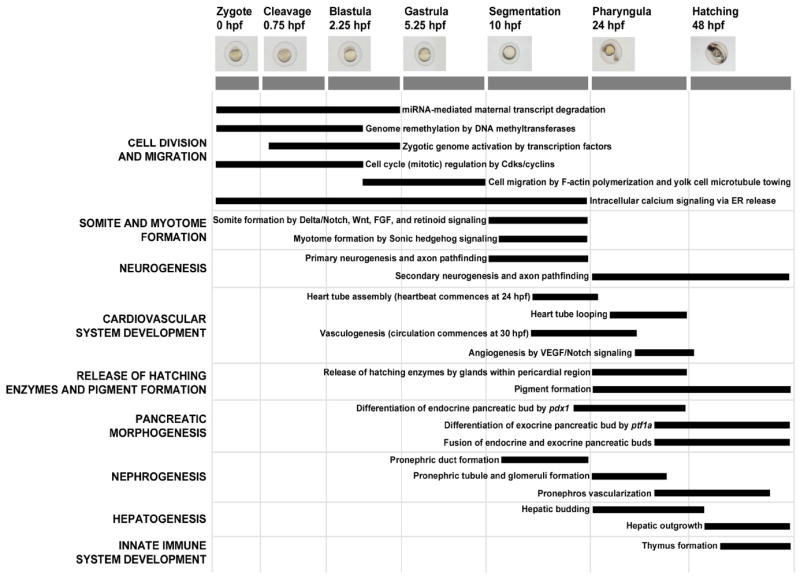
Figure 2.

Preliminary conceptual model of developmental landmarks during zebrafish embryogenesis. The y-axis lists a sampling of major developmental landmarks and the x-axis shows the timing and stages of zebrafish embryogenesis. Black bars denote the approximate duration of biological events that underlie each developmental landmark. hpf = hours post-fertilization.
