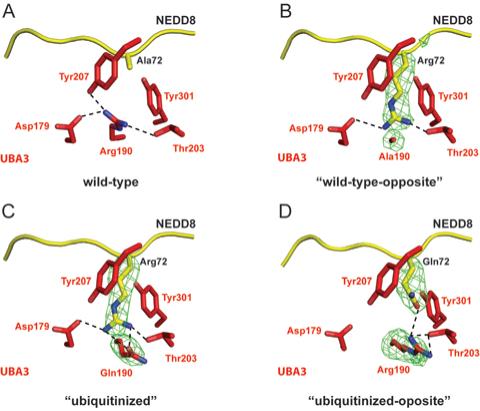
Figure 5. Differential APPBP1-UBA3 interactions with NEDD8 for UBA3 residue 190 and NEDD8 residue 72 mutants.

Stick-representation close-up views, with UBA3 colored red and NEDD8 colored yellow, nitrogen blue, oxygen light-red, and hydrogen bonds shown as dashed lines for (A) APPBP1-UBA3-NEDD8 (wild-type), (B) APPBP1-UBA3Arg190Ala-NEDD8Ala72Arg (“wild-type-opposite”), (C) APPBP1-UBA3Arg190Gln-NEDD8Ala72Arg (“ubiquitinized”), and (D) APPBP1-UBA3Arg190 (wt)-NEDD8Ala72Gln (“ubiquitinized-opposite”) complexes. Simulated annealing omit Fo-Fc electron density maps are shown in green mesh, contoured at 3σ over UBA3’s residue 190 and NEDD8’s residue 72 in panels B-D. The maps were calculated using the program CNS (32), after simulated annealing at 2000K omitting both UBA3’s residue 190 and NEDD8’s residue 72.
