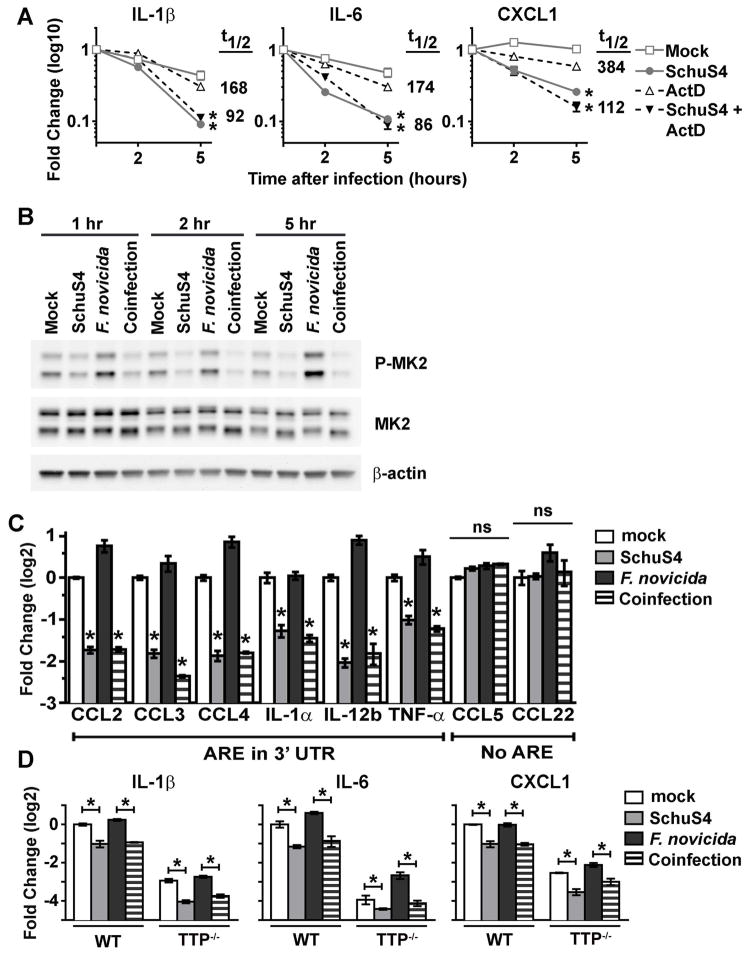
Figure 5. Destabilization of ARE-containing mRNA following SchuS4 infection.
(A) BMM were primed with P3C (500 ng/mL) and infected with SchuS4 MOI 50 and treated with actinomycin D (ActD) at the onset of infection to inhibit transcription. RNA was harvested from cells at the indicated times after infection and qRT-PCR was performed to quantify the indicated mRNA transcripts. mRNA half-life (t1/2) in uninfected and SchuS4-infected actinomcyin D-treated samples is indicated. *= p<0.05 comparing the indicated sample to both uninfected and actinomycin D-only treated cells. (B–C) BMM were primed with P3C (500 ng/ml) and infected with SchuS4 MOI 50, F. novicida MOI 10, or co-infected with both SchuS4 MOI 50 and F. novicida MOI 10. (B) Cell lysates were generated at the indicated times after infection. Western blots were probed with antibodies to P-MK2, and MK2 and actin as loading controls. Mock infected cells served as negative controls. (C) RNA was harvested from cells 5 h after infection and qRT-PCR was performed to quantify the indicated mRNA transcripts. Mock infected cells served as negative controls. * = p<0.05 comparing the indicated sample to both uninfected and F. novicida-only infected cells. ns = not significantly different. (D) WT controls and TTP−/− BMM were primed with P3C (500 ng/mL) and infected with SchuS4 MOI, F. novicida MOI 10, or co-infected with both SchuS4 MOI 50 and F. novicida MOI 10. RNA was harvested 5 h after infection. qRT-PCR was performed to examine the quantity of the indicated transcripts, normalized to GAPDH. *= p<0.05 comparing the indicated groups. Each data point depicts the mean of triplicate samples. Error bars represent SEM. Data are representative of three independent experiments.

