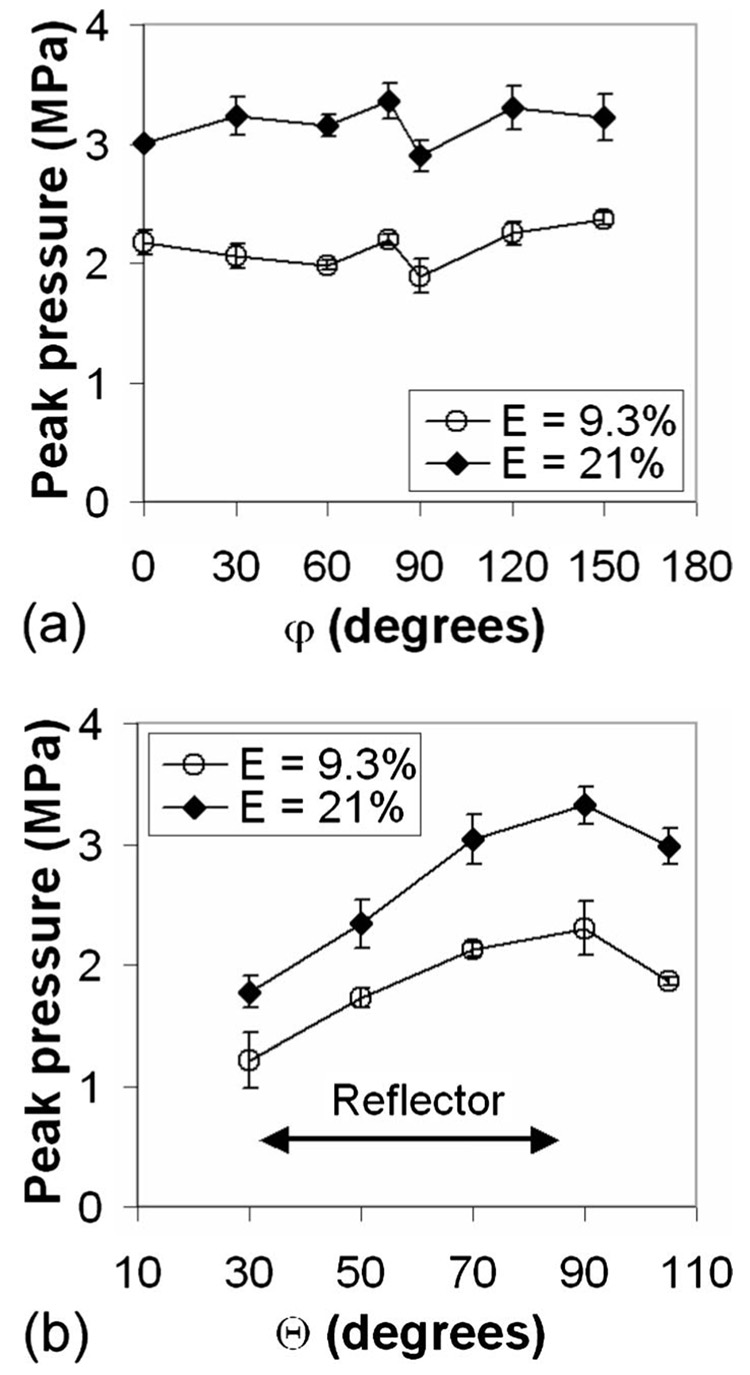
FIG. 5.
Angular variation of the peak pressure of laser-generated shock waves near F1, in the plane (a) Θ=90° and (b) φ=90°. Measurements were made at a stand-off distance of 3 mm from the laser spark, PRF=5 Hz, using signal averaging over 20 shots. Error bars represent standard deviation from three independent experiments.

