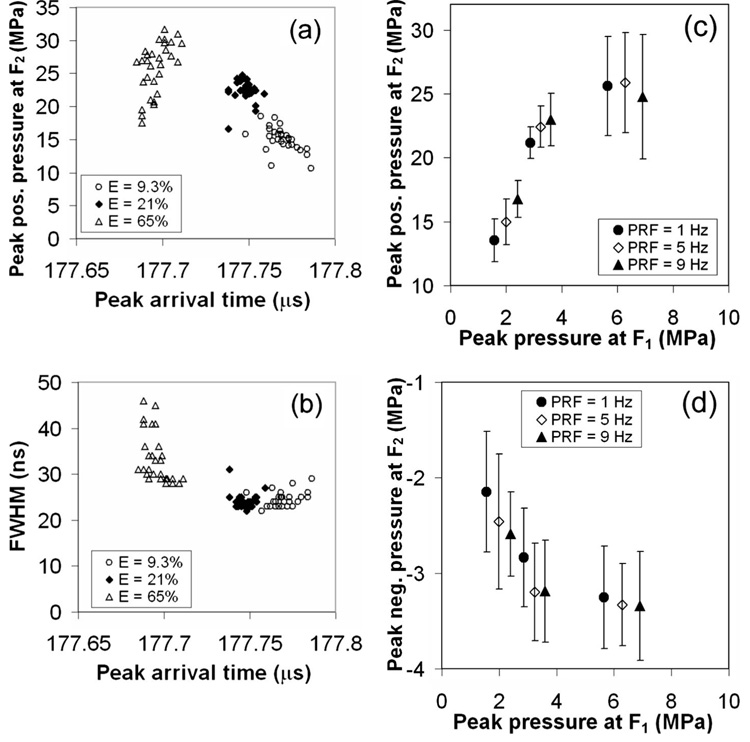
FIG. 8.
[(a) and (b)] The shot-to-shot variation (n=30) of pressure parameters measured at F2 at different laser energy levels. The mean with standard deviation of (c) peak positive and (d) peak negative pressure of shock wave at F2 at different energy levels (as represented by the different peak pressures at F1 and pulse repetition frequency (PRF) averaged over n=30 shots. Pressure at F1 was measured at a stand-off distance of 3 mm away from the laser spark.

