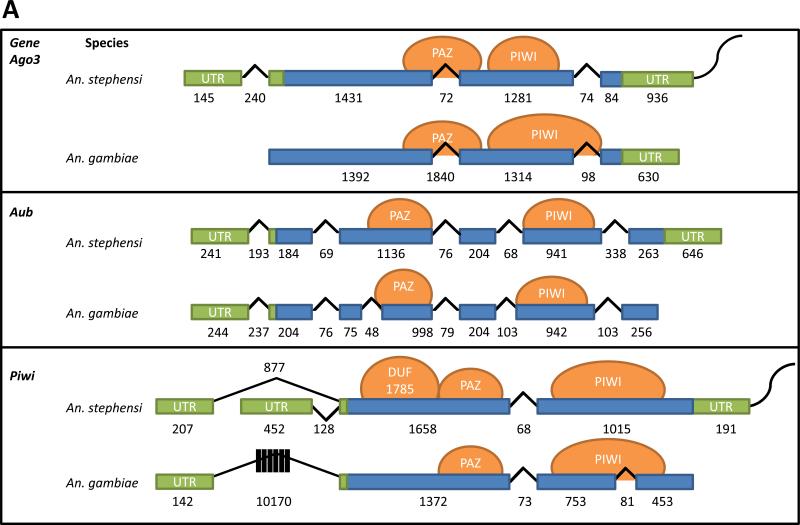
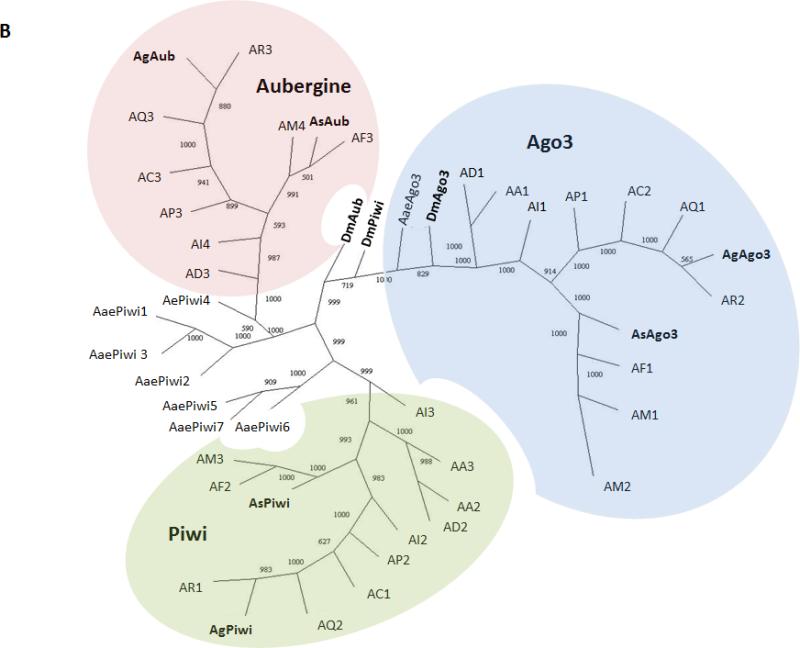
Figure 1. Gene structure comparisons and phylogenetic relationships of the An. stephensi Piwi family genes.
A) Schematic representations of transcription products for An. stephensi Ago3, Aub and Piwi detected in samples of ovaries collected at 48 hr PBM. Exons and introns are represented by boxes and lines, respectively, with the length in nucleotides indicated below each. Untranslated regions are colored green, open-reading frames are blue, predicted protein-binding domains are represented by orange circles and the polyA tail is the curved line at each 3’-end. B) Phylogenetic tree generated from alignment of predicted amino acid sequences for Piwi family proteins in An. stephensi (As), An. gambiae (Ag), Aedes aegypti (Aae), and Drosophila melanogaster (Dm). Bootstrap values between genes are listed between each pair of corresponding nodes. Genes from other mosquito species are represented: AA, Anopheles albimanus; AC, Anopheles christi; AD, Anopheles darlingi; AI, Anopheles dirus; AF, Anopheles funestus; AM, Anopheles minimus; AP, Anopheles epiroticus, AQ, Anopheles quadriannulatus and AR, Anopheles arabiensis. The digits following species name designations are arbitrary and correspond to the gene names listed in Table S1.


