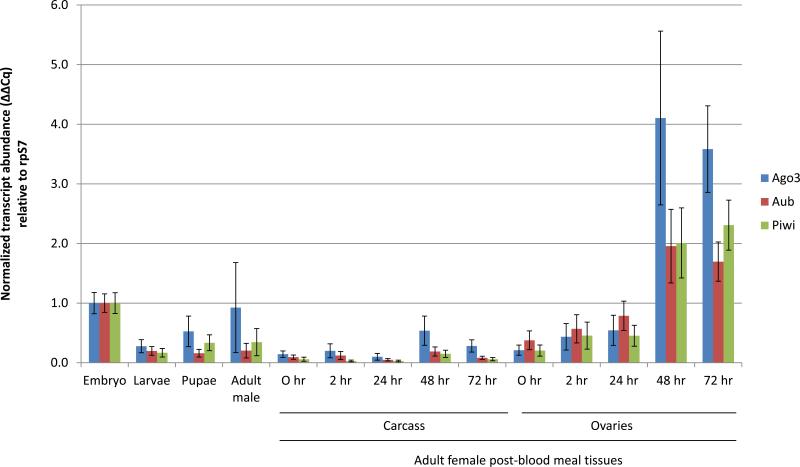
Figure 2. Abundance profiles of AsAgo3, Aub and Piwi transcripts during development.
Each histogram represents data (average ± SEM) of three biological replicates normalized to the embryo sample. Adult female 0 hr PBM samples were collected before blood-feeding. Embryos were collected between 0 and 2 hours following oviposition. p-values for all comparisons are listed in Table S2.

