
Fig. 3.
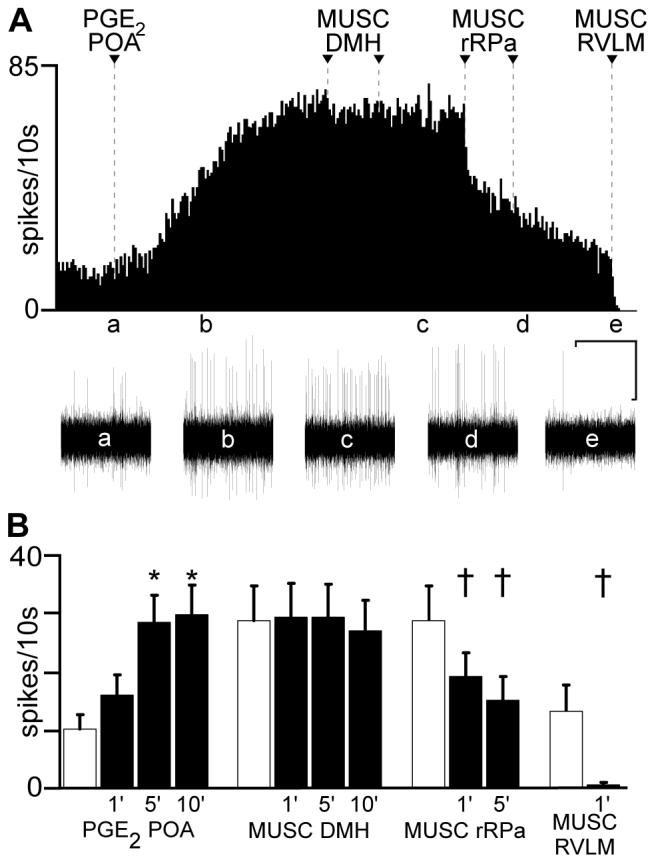
Increase in tail cutaneous vasoconstrictor (CVC) activity evoked by prostaglandin E2 (PGE2) into the preoptic area (POA) is not blocked by muscimol (MUSC) in the dorsomedial hypothalamus (DMH). A: rate histogram of multiunit tail CVC neuronal discharge following nanoinjection (arrowhead) of PGE2 into the POA. Traces a-e below the spike frequency histogram illustrate oscillographic records of neuronal activity at designated time points. Bilateral MUSC injections (arrowheads) were made into the DMH and two nanoinjections of MUSC (arrowheads) were made into the rostral raphe pallidus (rRPa). The residual activity remaining after MUSC into the rRPa was eliminated by nanoinjection of MUSC (arrowhead) into the right rostral ventrolateral medulla (RVLM). B: mean ± SE (n = 14 CVC neurons) discharge frequency of tail CVC neurons following PGE2 into the POA, MUSC into the DMH, MUSC into the rRPa and MUSC into the RVLM. Hatched bars represent mean discharge frequency during the 1 min control period prior to each treatment. The control discharge frequencies prior to MUSC into the DMH or into the rRPa were not different (P > 0.05) from that recorded 10 minutes after the PGE2-evoked activation. * and † indicate significant differences at P < 0.005 and P < 0.05, respectively, compared to respective control frequencies. Horizontal scale: 10 min for frequency histogram trace in A and 3.5s for oscillographic traces a-e; vertical scale bar: 20 μv for traces a-e.