
Figure 2. Topology of the signal transduction network in Dictyostelium and mammalian leukocytes.
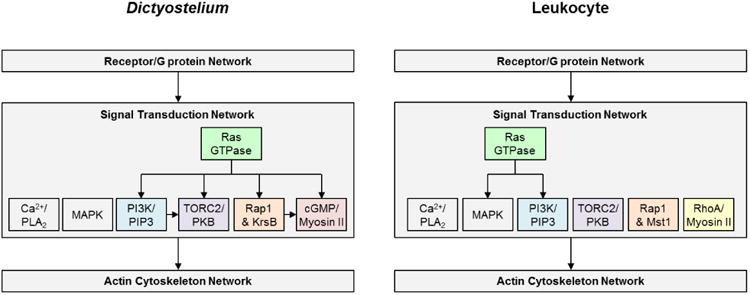
The signal transduction network is placed between the receptor/G protein and the actin cytoskeleton networks, while the polarity network is omitted from this figure. The individual modules within the Signal Transduction Network are represented by a specific color and these colors will be used to represent the modules in subsequent figures. The arrows depict interactions between the modules that are strongly supported in the literature.