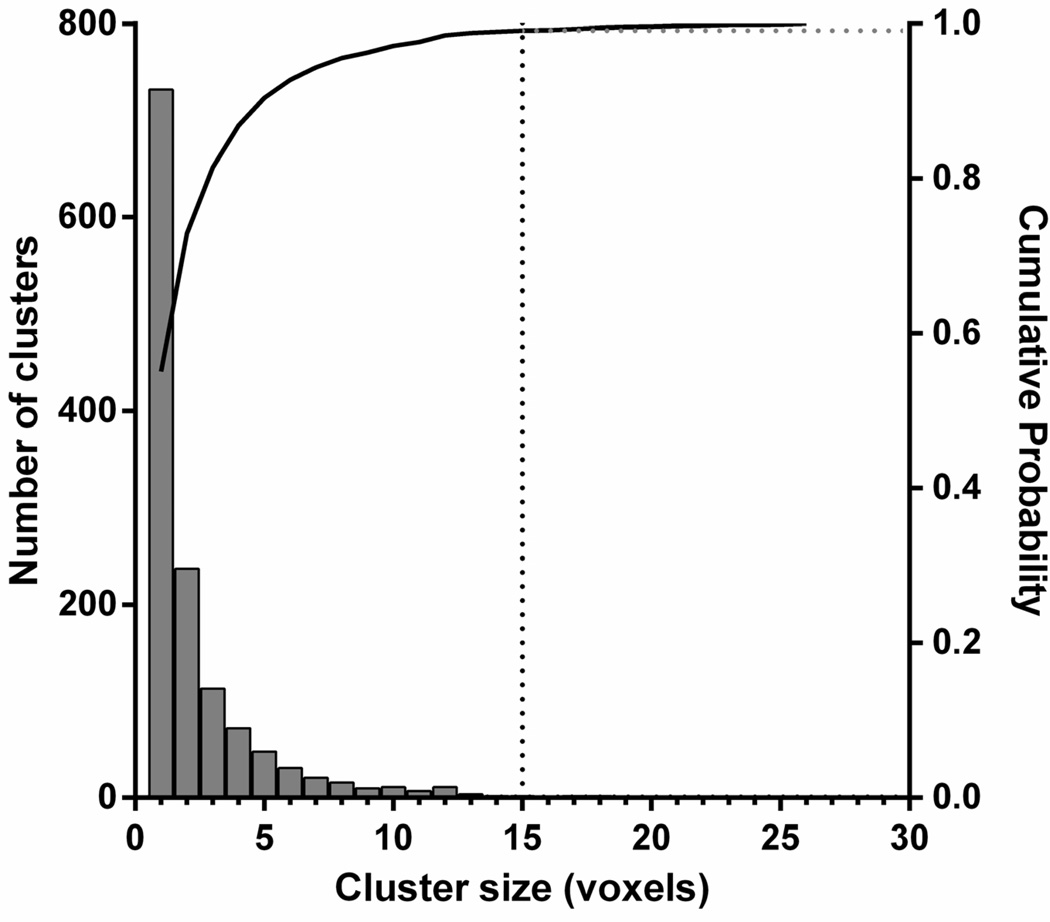
Figure 4.
Cluster size distribution after thresholding F maps produced from the simulated rest data. Solid curve represents cumulative probability. Dotted vertical line shows where to set cluster size threshold to exclude 99 % (p < 0.01) of clusters that will occur by chance in the lp-ntPET anlaysis of rest data (no dopamine activation) based on 100 simulations of phantom images.

