
Figure 4.
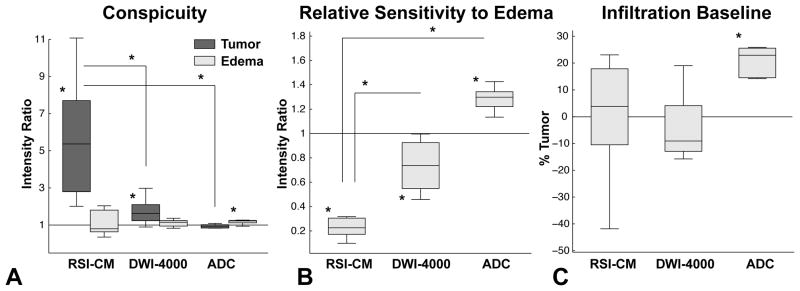
Box-and-whisker plots of intensity ratios quantifying tumor and edema conspicuity (A) and relative sensitivity to edema (B). On each box, the central mark is the median, the edges of the box are the 25th and 75th percentiles, the whiskers represent data ranges, and the red dots indicate potential outliers. A, TC was significant on RSI-CM (p = .001) and DWI-4000 (p = .005), but not ADC (p = 0.11). TC was significantly greater on RSI-CM compared with DWI-4000 (p = .002) and ADC (p < .001). B, RSE was significantly less in RSI-CM versus DWI-4000 (p < .001) and ADC (p < .001). (C) Box-and-whisker plots of the infiltrative baseline, defined as the percentage of tumor signal required within edema to equalize the signal to NAWM. The infiltrative baseline of ADC was significantly greater than RSI-CM (p < .001) and DWI-4000 (p < .001). Note: negative datapoints may reflect tumor infiltrated edema. TC – Tumor Conspicutiy, EC –Edema Conspicuity, RSE – Relative sensitivity to edema.