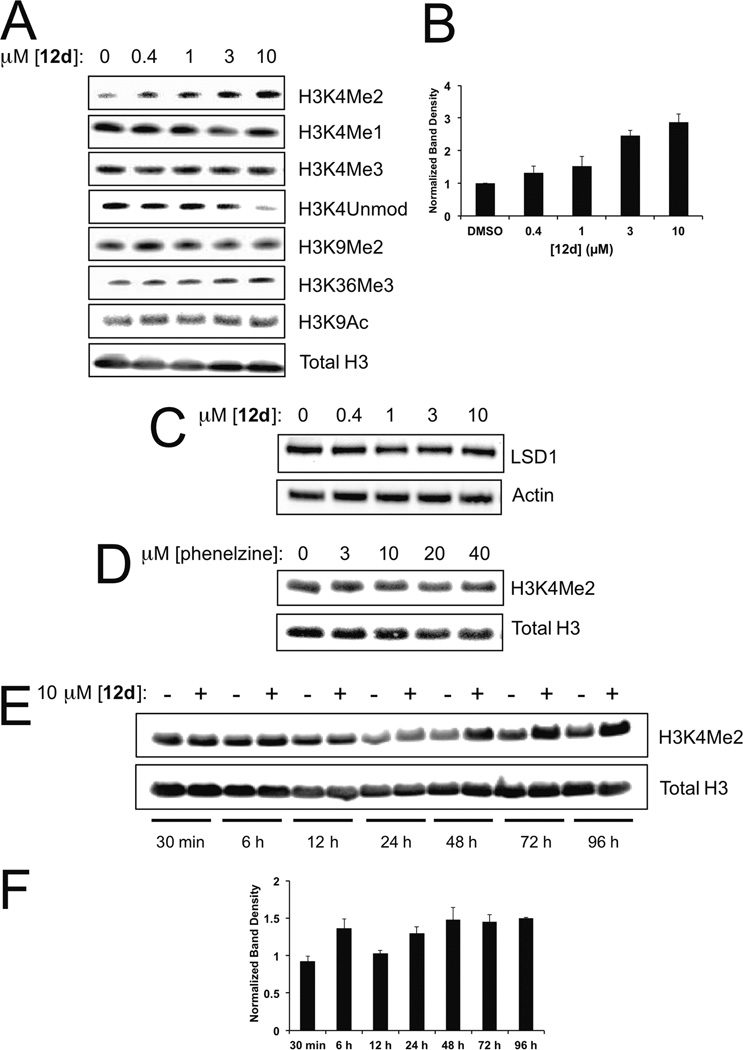
Figure 5.
LSD1 inhibition by compound 12d (bizine) in LNCaP cells. (A) Cells were treated with compound 12d (bizine) (0.4–10 µM) for 48 h and blotted against indicated proteins. (B) H3K4Me2 band density quantification plot. Statistically significant increases were observed at 3 µM and 10 µM 12d (bizine) treatment as determined by three biological replicates. (C) Cells were treated with compound 12d (bizine) (0.4–10 µM) for 48 h and blotted against LSD1 and actin. (D) Cells were treated with phenelzine (3–40 µM) for 48 h and blotted against H3K4Me2 and total H3. (E) Cells were treated with 10 µM compound 12d (bizine) and collected at various indicated time points and blotted against H3K4Me2 and total H3. (F) H3K4Me2 band density quantification plot normalized to vehicle at each indicated time point after 10 µM 12d (bizine) treatment. Statistically significant increases were observed at 6, 24, 48, 72, and 96 h but not at 30 min and 12 h based on 3 biological replicates.

