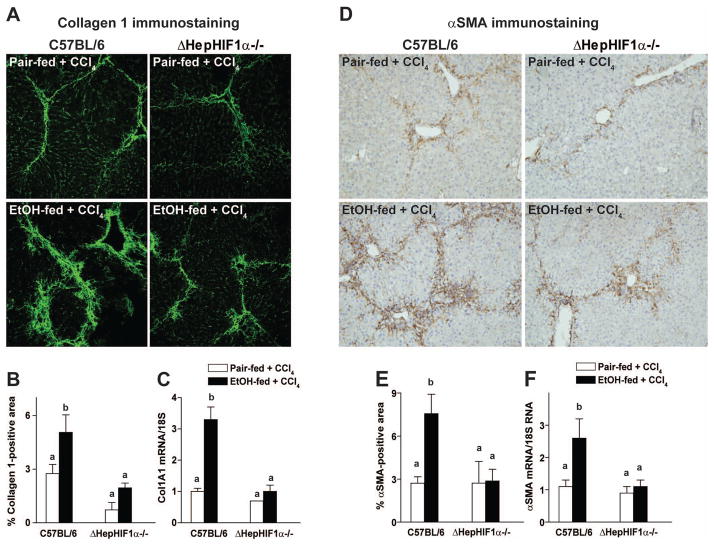
Figure 5. Ethanol-induced exacerbation of CCl4–induced collagen 1 and smooth muscle actin expression were reduced in livers of ΔHepHIF1α−/− mice.
C57BL/6 wild-type and ΔHepHIF1α−/− mice were allowed free access to diets with ethanol (11% of kcal) or pair-fed controls for 4 days followed by CCl4 injections, as described in methods. (A) Frozen liver sections were used for Collagen1 staining. Images are acquired using 20X objective. (B) Areas positive for collagen1 were quantified using Image Pro-Plus software and analyzed. (C) mRNA expression of Col1A1 was detected in mouse livers using qRT-PCR measurement. (D) Paraffin-embedded liver sections were de-paraffinized and stained for αSMA staining. Images are acquired using 10X objective. (E) Areas positive for αSMA were quantified using Image Pro-Plus software and analyzed. (F) mRNA expression of αSMA was detected in mouse livers using qRT-PCR measurement. Values with different alphabetical superscripts were significantly different from each other, p< 0.05. n=4–6.

