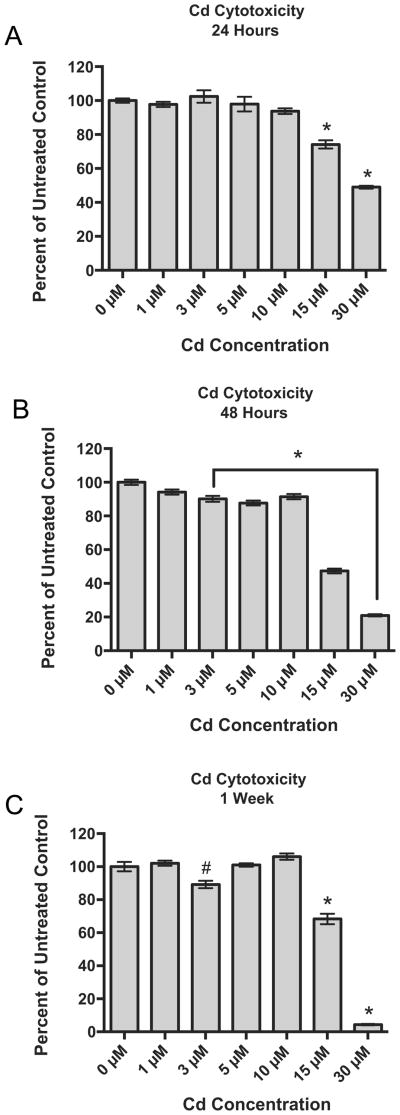
Fig. 1.
Concentration- and time-dependent effects of Cd on the viability of RPTEC/TERT1 cells after (A) 24 h, (B) 48 h and (C) 1 week of Cd exposure. Viabilities are expressed as percent of untreated control, 0 μM, at each time point as indicated by the MTT viability assay. Bars represent mean viability (n = 8) ± SEM, * indicates significant difference from 0 μM at each respective time point, p < 0.001, and # indicates significant difference from 0 μM at each respective time point, p < 0.05.

