
Fig. 3.
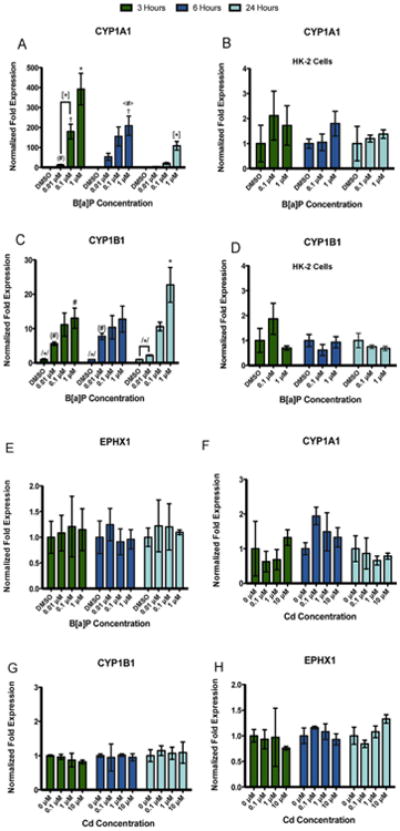
Compound-specific as well as concentration- and time-dependent changes in gene expression are observed in phase I metabolic enzymes in RPTEC/TERT1 cells but not HK-2 cells. RPTEC/TERT1 cells were treated with B[a]P or Cd for 3, 6, and 24 h. HK-2 cells were exposed to B[a]P for 3, 6, and 24 h for comparative purposes. (A) CYP1A1 and (C) CYP1B1 gene expression increased significantly after exposure to B[a]P in RPTEC/TERT1 cells at all time points while HK-2 cells showed no response to B[a]P after any time point (B) and (D). There were no significant changes in (E) EPHX1 gene expression detected after B[a]P treatment. Additionally, no significant changes in gene expression were detected in (F) CYP1A1, (G) CYP1B1, or (H) EPHX1 after Cd treatment at any time point or concentration. Bars represent mean fold expression (n = 3) ± SEM. All genes of interest were normalized to ACTB. Expression of genes in the DMSO or 0 μM control groups, where denoted, was set to 1. * Indicates significant difference from DMSO or 0 μM controls at each respective time point, p < 0.001,† indicates significant difference from DMSO or 0 μM controls at each time point, p < 0.01, # indicates significant difference from DMSO or 0 μM controls at each time point, p < 0.05, [*] indicates significant difference from 1 μM B[a]P at 3 h, p < 0.001, /*/ indicates significant difference from 1 μM B[a]P at 24h, p < 0.001, (#) indicates significant difference from 0.1 μM B[a]P at 3 h, p < 0.05, <#> indicates significant difference from 1 μM B[a]P at 3 h, p < 0.05, and {#} indicates significant difference from 1 μM B[a]P at 24 h, p < 0.05.