
Fig. 4.
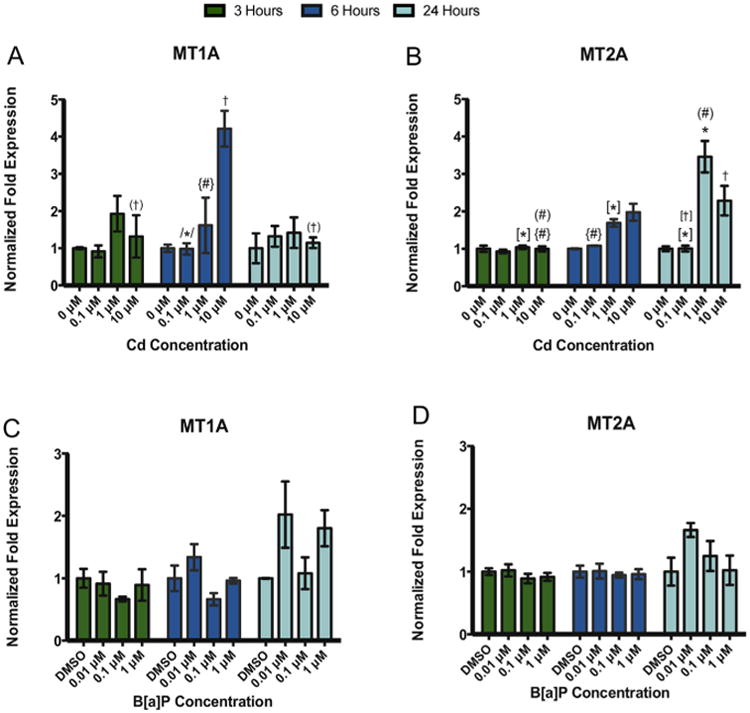
Treatment with Cd but not B[a]P resulted in significant changes in MT1A and MT2A gene expression in RPTEC/TERT1 cells. Exposure to Cd resulted in a significant increase in (A) MT1A at 10 μM Cd after 6 h and in (B) MT2A after 3, 6, and 24 h. In contrast, exposure to B[a] P after 3, 6, and 24 h did not result in significant changes in (C) MT1A or (D) MT2A gene expression. Bars represent mean fold-expression (n = 3) ± SEM. All genes of interest were normalized to ACTB. Expression of genes in the DMSO or 0 μM control groups, where denoted, was set to 1. * Indicates significant difference from DMSO or 0 μM controls at each respective time point, p < 0.001, † indicates significant difference from DMSO or 0 μM controls at each time point, p < 0.01, # indicates significant difference from DMSO or 0 μM controls at each time point, p < 0.05. [*] Indicates significant difference from 1 μM Cd at 24 h, p < 0.001, /*/ indicates significant difference from 10 μM Cd at 6 h, p < 0.001, (†) indicates significant difference from 10 μM Cd at 6 h, p < 0.01, [†] indicates significant difference from 10 μM Cd at 24 h, p < 0.01, (#) indicates significant difference from 10 μM Cd at 24 h, p < 0.05, and {#} indicates significant difference from 10 μM Cd at 6 h, p < 0.05.