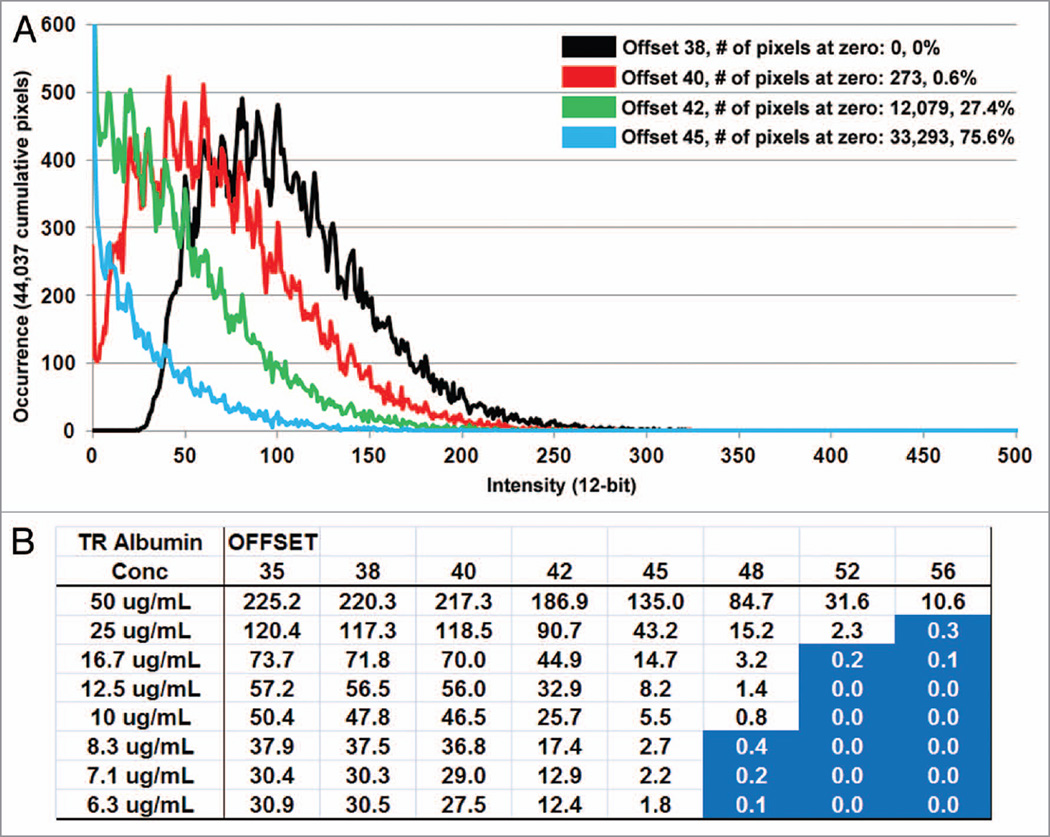
Figure 3.
Effect of higher offsets on pixel values. Histograms generated from the 12.5 ug/mL TR-RSA concentration images show an increasing number of individual pixels with values of zero as offset is increased. (A) Histograms for offsets 38, 40, 42 and 45 are shown in black, red, green and blue, respectively. The Y-axis showing the number of occurrences for a specific pixel value is truncated at 600. The total number of pixels counted in the area was 44,037. Images taken at offsets 42 and 45 had 12,079 and 33,293 pixels with a value of zero, respectively. Note the bell shaped curves seen for offsets 38 and 40, which become sharply rising curves peaking with increasing values at zero for offsets 42 and 45. (B) A table shows average intensity values for each offset at the varying concentrations of TR-RSA. Average intensity values fall below zero at higher offsets (shown in blue) and at lower concentrations where fluorescence becomes weaker. Note the proportional drop in fluorescence between concentrations of TR-RSA at the lower offsets while higher offsets show a disproportionately larger decrease in intensity values as the concentration of TR-RSA decreases.

