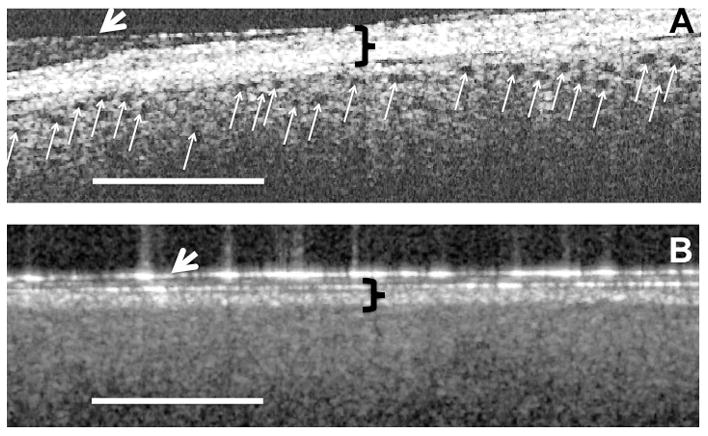
Figure 1.

Figure A is an OCT image of a donor kidney that received mannitol 15 minutes or less prior to clamping the renal artery. The black holes (indicated by the small white arrows) represent open tubules just under the kidney capsule. Figure B is an OCT image of a donor kidney that received mannitol 30 minutes or more prior to clamping the renal artery. There are no open tubules in B due to occluding of the tubule lumens with swollen cells. The patient receiving the donor kidney seen in figure A exhibited a return to normal serum creatinine levels within two days, while the patient receiving the donor kidney seen in figure B did not recover to within normal serum creatinine values (i.e., less than 1.4 mg/dL) until nearly two weeks following transplant. The black brackets indicate the kidney connective tissue capsule while the white arrows indicate a layer of Tegaderm. The white scale bare=500μM
