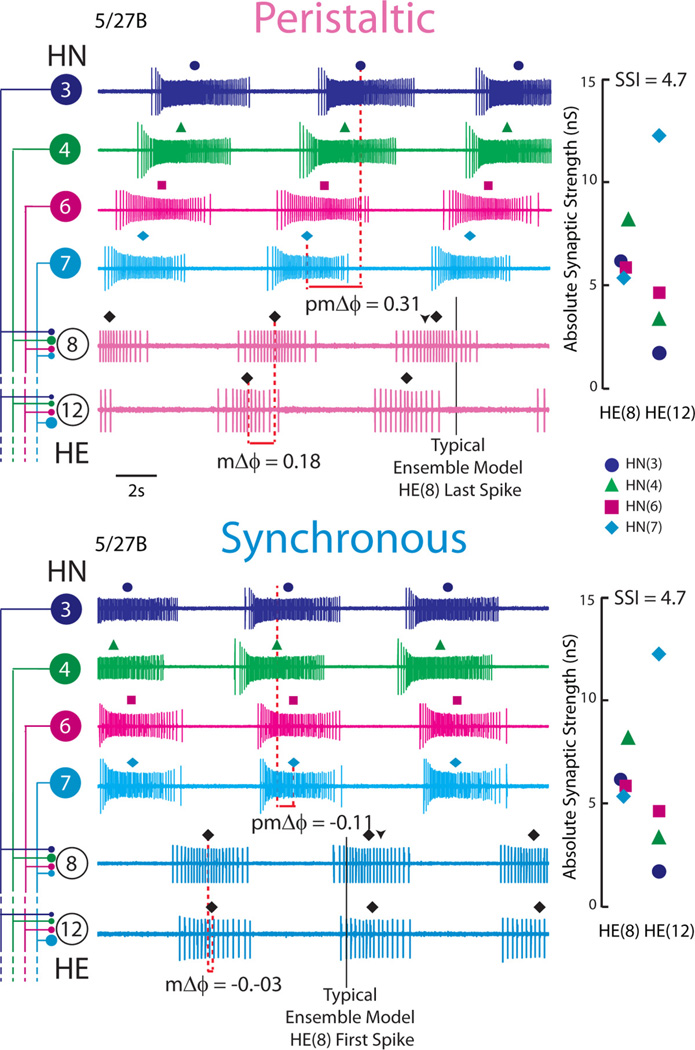
Figure 1.
Simultaneous ipsilateral extracellular recordings from the HN(3), HN(4), HN(6), and HN(7) premotor interneurons and from the ipsilateral HE(8) and HE(12) motor neurons for the 5/27B preparation in both synchronous and peristaltic coordination modes. The absolute synaptic strength profiles for the HE(8) and HE(12) motor neurons in this preparation, measured immediately after the record illustrated was taken, is shown to the right, while on the left the iconic circuit diagram labels the extracellular traces. The large circles represent cell bodies of the heart (HN) interneurons and heart (HE) motor neurons, and the small filled circles, inhibitory synaptic connections. The connections are sized in proportion to their relative strengths as embodied in the synaptic strength profiles on the right. The middle spike is indicated above each HN or HE burst. On the peristaltic traces, the downward arrowhead indicates the middle spike of the HE(8) ensemble model motor neurons, while the vertical line indicates the typical point where the HE(8) model motor neurons tend to stop firing (as measured in phase). On the synchronous traces, the downward arrowhead indicates the middle spike of the HE(8) ensemble model motor neurons, while the vertical line indicates the typical point where the HE(8) model motor neurons tend to start firing (as measured in phase). The premotor phase progression (pmΔϕ) and the motor phase progression (mΔϕ) are defined in Materials and Methods. The data in this figure were kindly provided by Dr. Brian J. Norris (California State University, San Marcos, CA) from experiments described by Norris et al. (2011). The color/symbol schemes describing each premotor heart interneuron is repeated in Figures 2 A23, 6, and 9 (see key).

