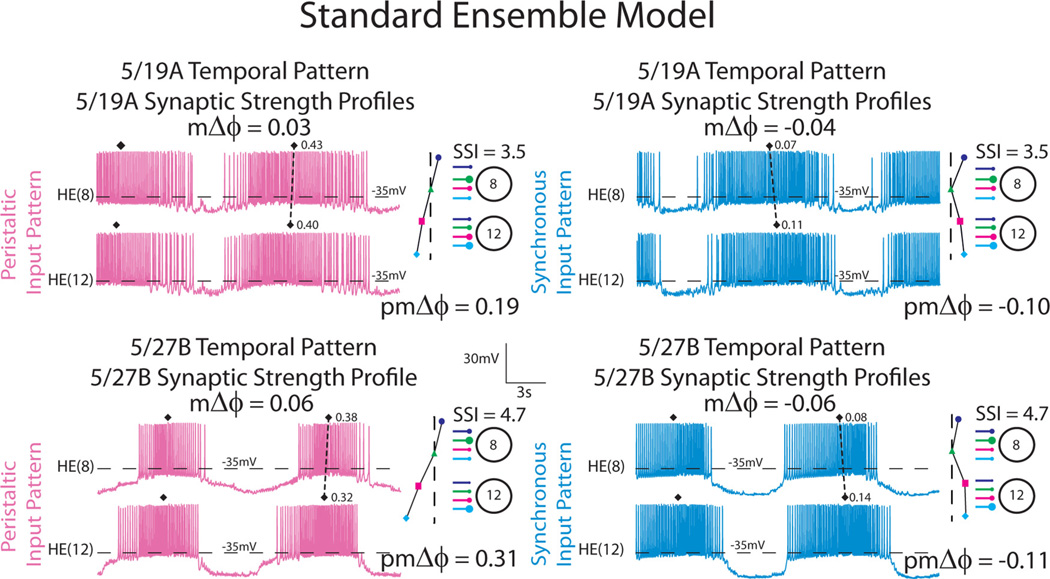
Figure 3.
Our ensemble model home simulations are illustrated with simultaneous bilateral voltage traces from the HE(8) and HE(12) model motor neurons receiving the 5/19A input pattern (top two panels) and the 5/27B input pattern (bottom two panels). The dashed line connecting filled diamonds shows the intersegmental motor phase progressions, peristaltic (pink) and synchronous (light blue), between the two motor neurons. An iconic representation of the temporal pattern, peristaltic and synchronous, and synaptic strength profiles with SSIs measured in the living system in those preparations is shown to the right of the corresponding voltage traces. The vertical dashed lines are aligned to the HN(4) interneuron middle spike phase, facilitating a comparison of the temporal patterns (i.e., the premotor phase progression) of the premotor interneurons measured in these preparations. The large circles represent cell bodies of the HE(8) and HE(12) motor neurons. The sizes of the filled circles show the relative synaptic strengths of the premotor HN interneurons onto the heart motor neurons measured in the living system in those preparations. The color code is the same as in Figure 1.

