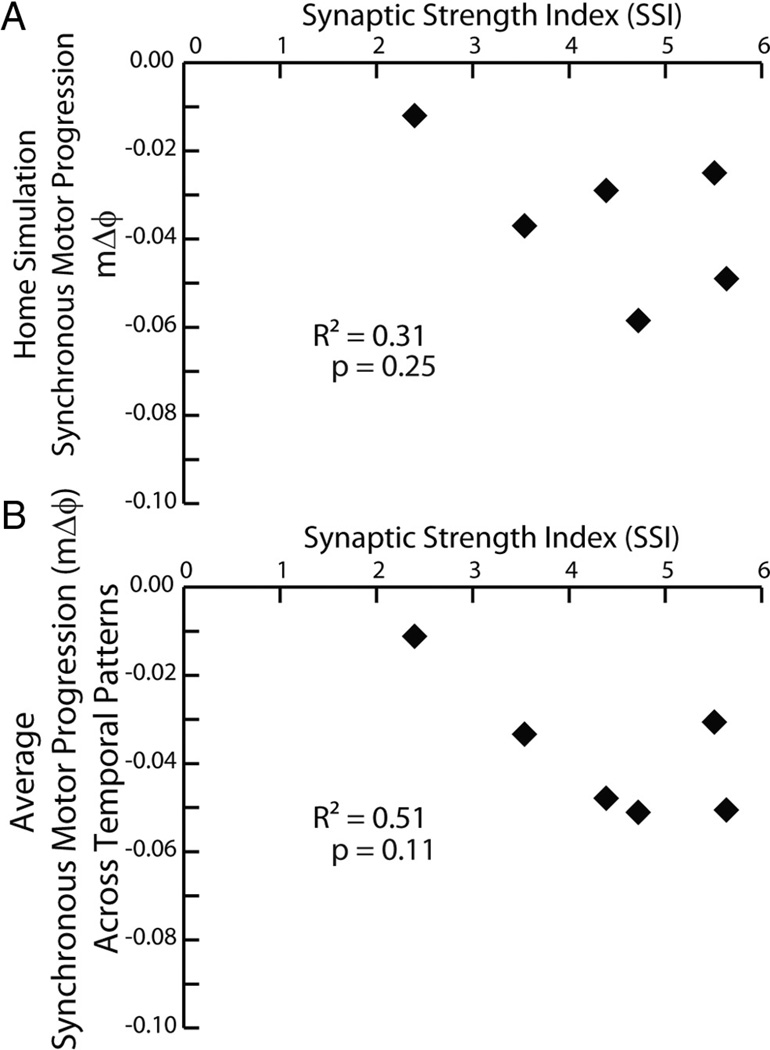
Figure 5.
A, B, Correlation of the synchronous motor phase progression versus SSI (see Materials and Methods) for both the ensemble model home simulations (A) and from the average synchronous motor phase progression for the given synaptic strength profiles across temporal patterns from the mix-and-match simulations (B).

