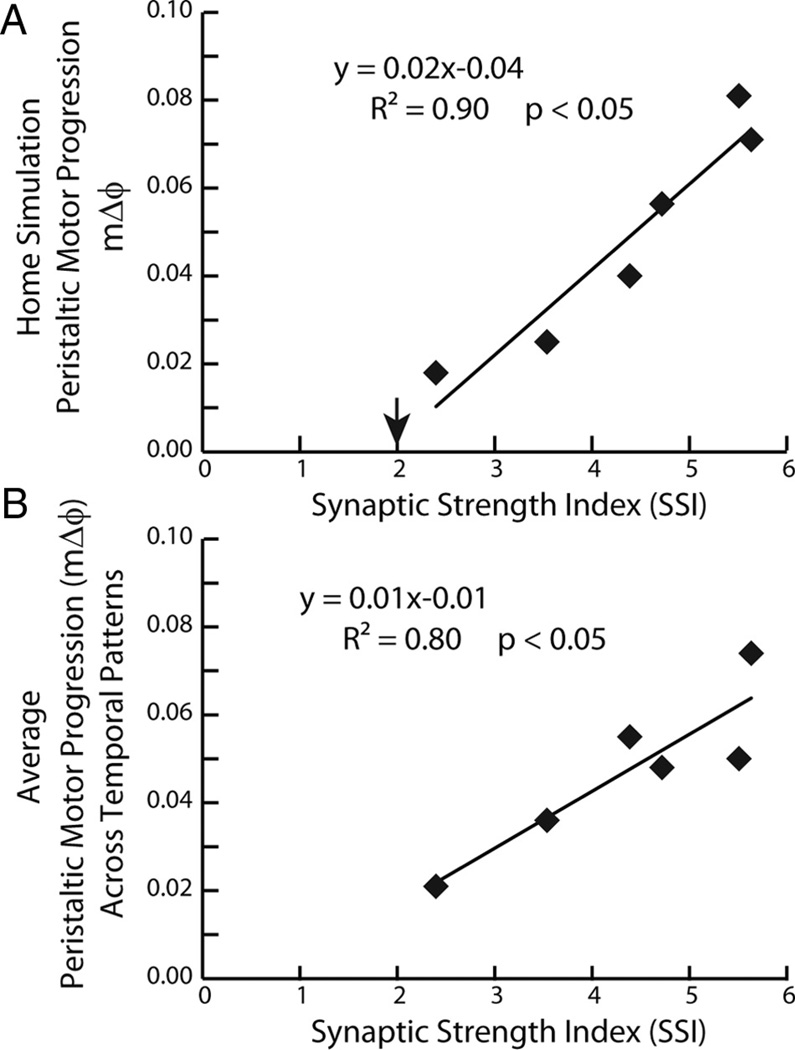
Figure 8.
A, B, Correlation and regression line for the peristaltic motor phase progression versus the SSI for both the ensemble model home simulations (A) and from the average peristaltic motor phase progression for the given synaptic strength profiles across temporal patterns from the mix-and-match simulations (B). The downward arrow in A indicates the SSI value at which the peristaltic motor phase progression changes sign and the motor phase progression no longer resembles a true peristaltic progression between the HE(8) and the HE(12) motor neurons. Because the correlations were significant, regression lines were also computed: equations are shown.

