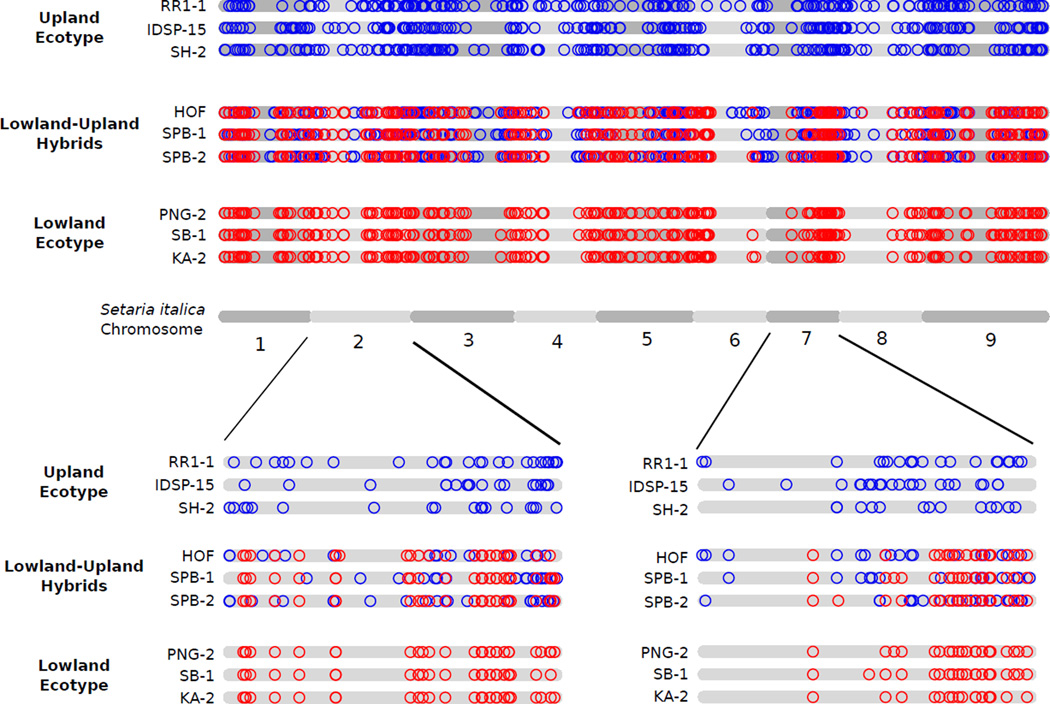
Figure 3.
Genome-wide distribution of ecotype-specific alleles in lowland-upland hybrids. Alleles private to either ecotype are mapped to the reference genome of Setaria italica. Patterns are shown in the three identified lowland-upland hybrid samples as well as three upland ecotype and three lowland ecotype samples. Red = lowland ecotype allele. Blue= upland ecotype allele. To normalize for the overall higher number of upland private alleles in the data set (due to the higher number of upland versus lowland samples), a random subset of 25% of upland alleles is plotted. Genomic regions of predominantly upland or lowland ancestry can be identified. Magnifications of chromosomes 2 and 7 show chromosome-wide patterns at higher resolution.

