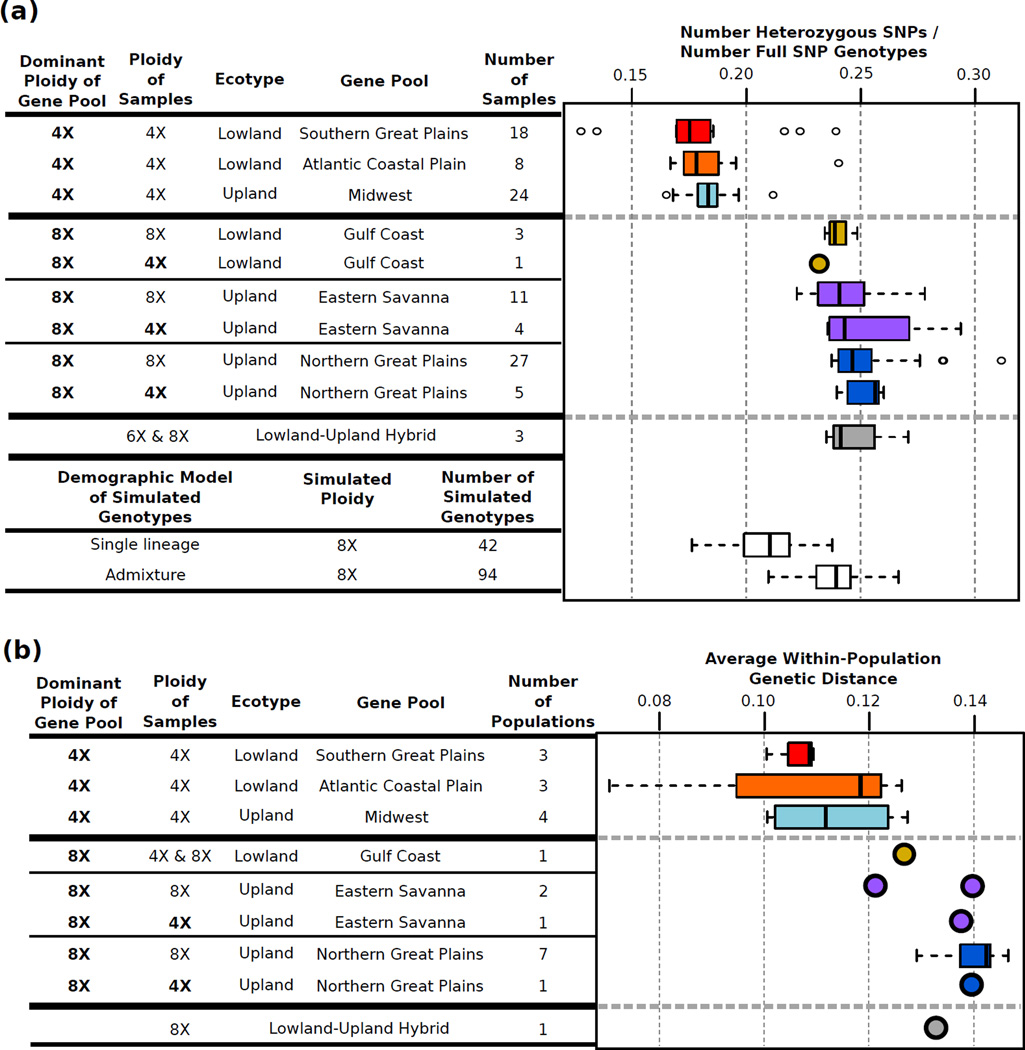
Figure 4.
Genetic diversity of switchgrass gene pools. Samples (a) and populations (b) from gene pools with both 4X and 8X samples are divided into subgroups by ploidy. (a) Number of heterozygous SNPs divided by the number of SNPs with full diploid genotype calls as an estimate of heterozygosity for each sample. Simulated octoploid genotypes were generated by combining genotypes from tetraploids either from the same gene pool ("Single lineage") or different gene pools ("Admixture"). Heterozygosity levels in predominantly-8X gene pools is more similar to the admixed rather than the single lineage simulated octoploids. (b) Average within-population genetic distance as an estimate of nucleotide diversity. Note that heterozygosity (a) and nucleotide diversity (b) is the same for both 4X and 8X samples from primarily-8X gene pools. Also, primarily-8X gene pools have similar diversity levels as natural (Lowland-Upland Hybrids) and simulated admixed samples.

