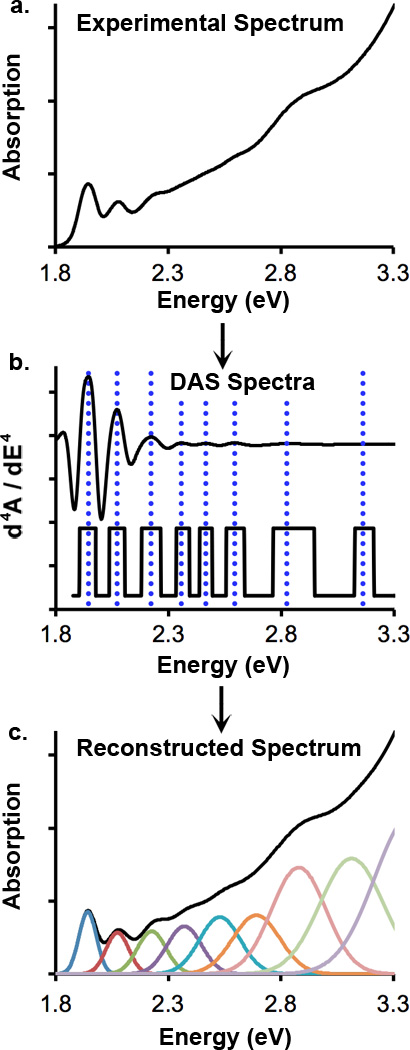
Figure 2.

Mathematical extraction of electronic transition energies and oscillator strengths for quantum-confined nanostructures. (a) An experimental spectrum is first subject to mathematical line narrowing through differentiation with respect to energy, resulting in differential absorption spectra. (b) Fourth derivatives are shown: the top is the original differential spectrum and the lower spectrum has been flattened to reveal lower intensity features. Vertical dotted lines indicate observed transition energies. (c) Using these energies, least squares fitting is used to reconstruct the original spectrum from a sum of Gaussian peaks with initial guesses for transition energies derived from differential absorption spectroscopy analysis. Integrated peak areas correspond to oscillator strengths.
