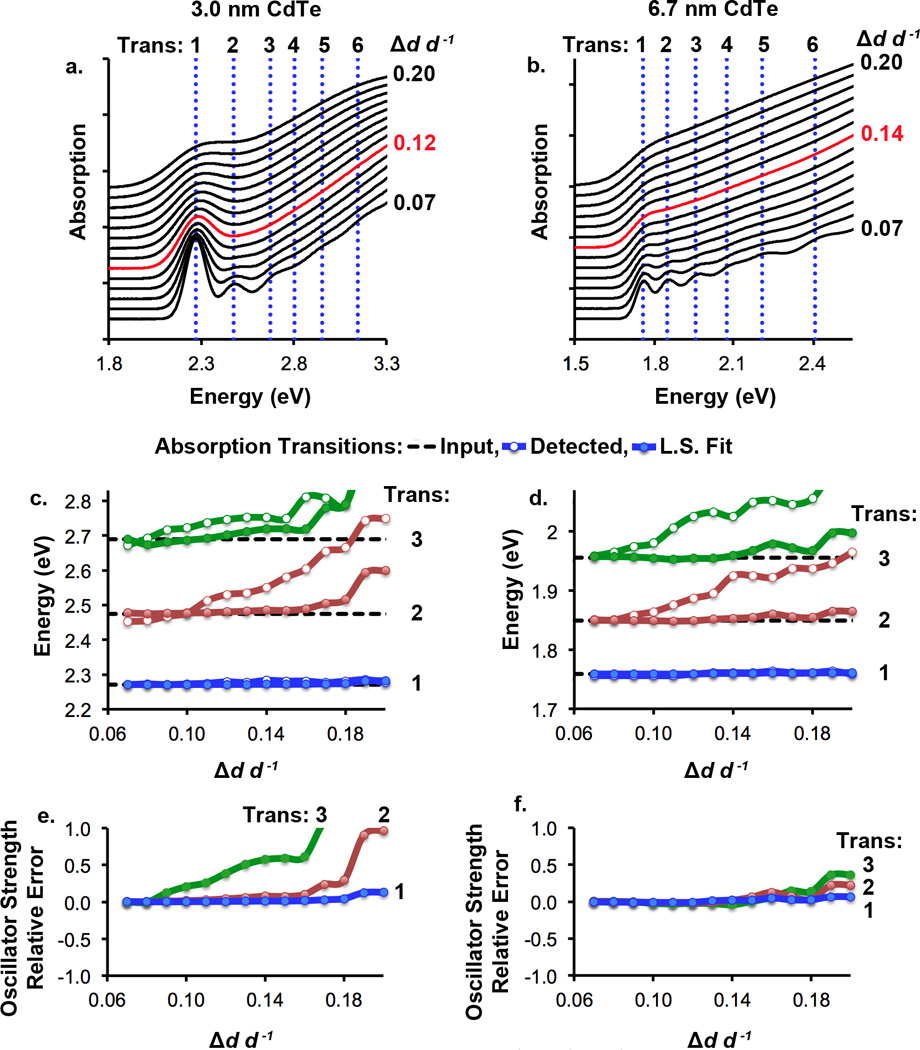
Figure 3.

Effect of quantum dot size dispersion on the extraction accuracy of electronic transition energies and oscillator strengths. Spectra were generated from sums of Gaussian curves with contributing noise and widened according to specific dispersions of diameter (Δd d−1). Panels (a) and (b) show the spectra that were generated from Gaussian peaks with energies noted by vertical dotted lines (transitions 1–6). Panels (c) and (d) show peaks that were extracted from the 4th derivatives of these spectra (colored lines with open circles), and then fit to the original spectrum (colored lines with closed circles), in addition to the input energy for each peak (dotted black lines). Panels (e) and (f) depict the relative oscillator strengths of the 1st (blue), 2nd (red), and 3rd (green) absorption transitions with size dispersion.
