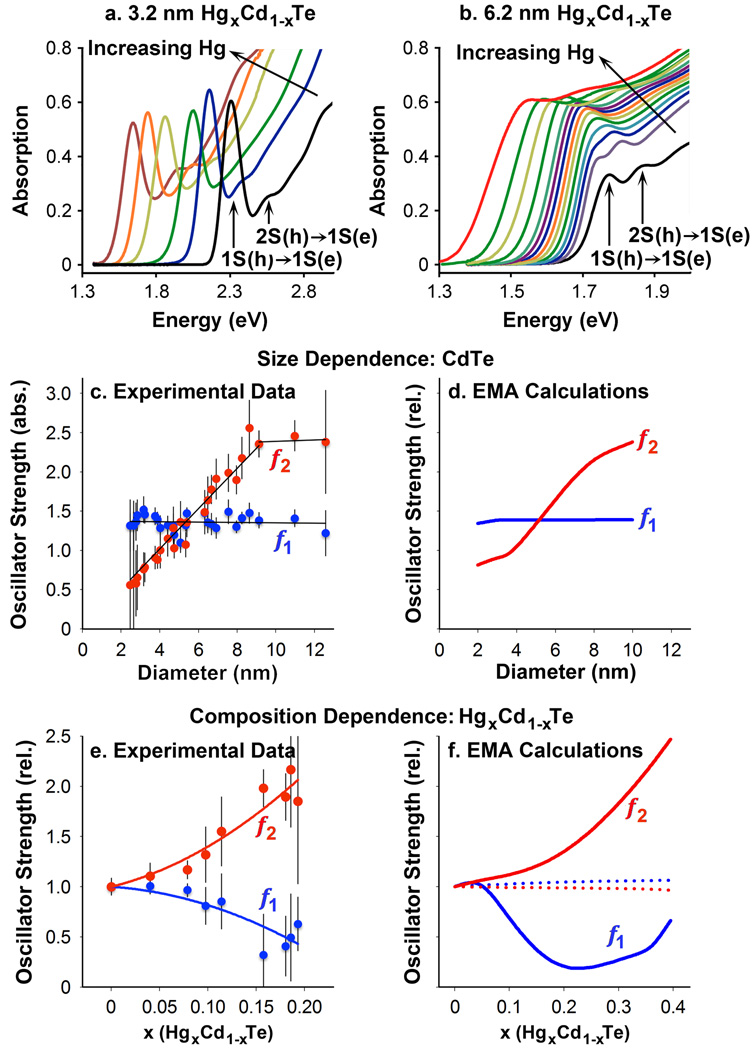
Figure 5.
Optical absorption spectra during HgxCd1-xTe cation exchange. Mercury cation exchange was performed on CdTe cores with a diameter of (a) 3.2 nm or (b) 6.2 nm. For 3.2 nm nanocrystals, absorption increases substantially at high energy with little change in band-edge oscillator strength. For the 6.2 nm nanocrystals the 2nd exciton peak becomes dominant with increasing mercury content. (c) Experimental oscillator strengths of the 1st exciton transition (f1, blue) and 2nd exciton transition (f2, red) for CdTe QDs with sizes from ~2 to 12 nm diameter, in absolute units. (d) Theoretical EMA calculations plotted in relative units. (e) Experimental oscillator strengths of the 1st and 2nd exciton transitions for large CdTe nanocrystals (6.2 nm) after cation exchange in relative units. (f) Theoretical EMA calculations are plotted in relative units. For plots in (c)–(f), solid curves show values for core/shell nanocrystals and dotted lines indicate values for homogeneous alloys. Error bars are s.d.

