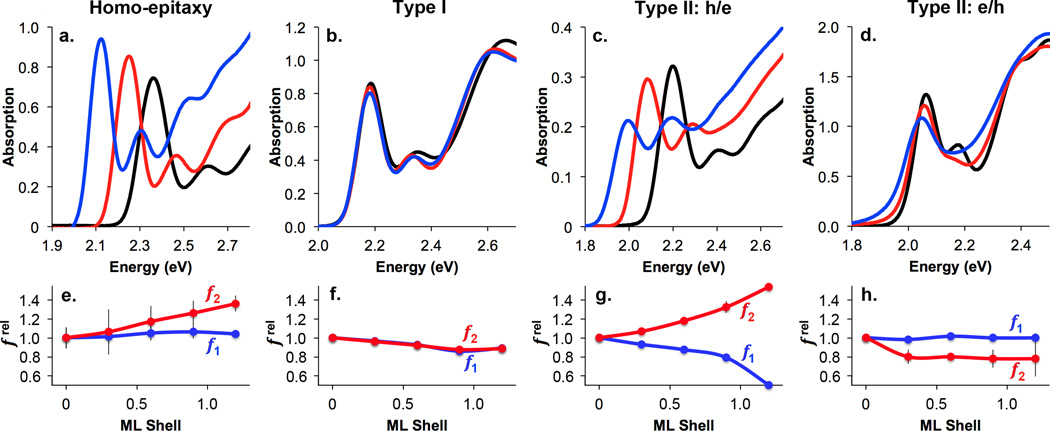
Figure 6.
Epitaxial shell growth in 4 different carrier localization regimes. Absorption spectra are shown in a-d and relative oscillator strengths are plotted for the 1st exciton transition () and 2nd exciton transition () in e–g. Regimes are designated as: (a, e) Homoepitaxial growth (CdTe/CdTe), (b, f) Type I with electron and hole in the core (CdSe/ZnS), (c, g) Type II h/e with the hole in the core and electron in shell (CdTe/CdSe), and (d, h) Type II e/h with the electron in the core and hole in the shell (CdSe/ZnTe). Absorption spectra show cores with nominal shell thicknesses of 0 (black), 0.6 (red), and 1.2 (blue) monolayers (ML). Error bars are s.d.

