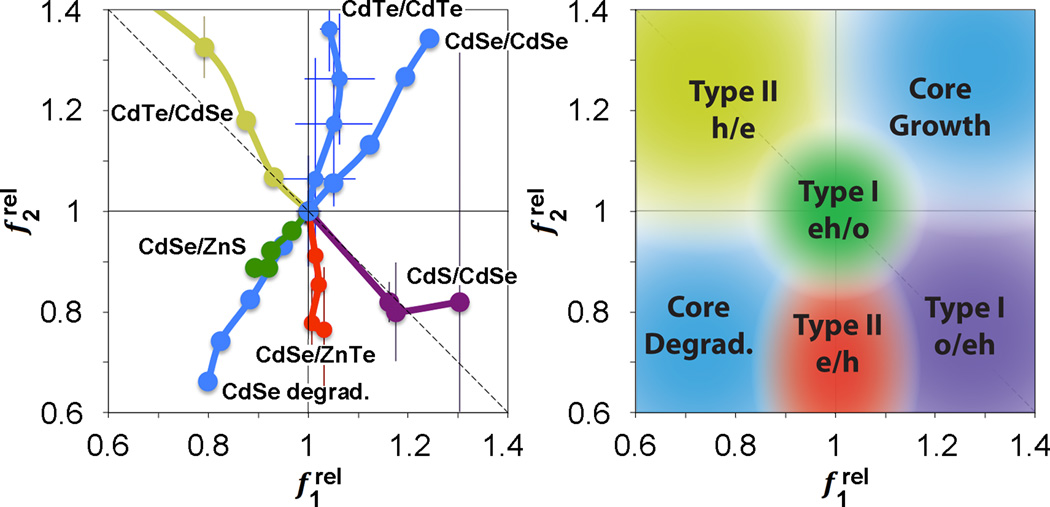
Figure 7.
Relative oscillator strength phase diagrams showing different localization regimes for charge carriers in core-shell QDs. Left: Example experimental data from epitaxial shell growth. Right: Summary chart of charge carrier localization regimes from 24 experiments of homoepitaxial shell growth (“core growth”) and core etching (“core degradation”) of CdSe and CdTe, as well as shell growth experiments for Type-I eh/o materials (CdSe/ZnS, CdSe/CdS, CdS/ZnS), Type-I o/eh materials (CdS/CdSe), Type-II h/e materials (CdTe/CdSe), and Type-II e/h materials (CdSe/ZnTe, CdS/ZnSe). The diagonal dashed line indicates a region for zero net change in combined band edge oscillator strength. Error bars are s.d.

