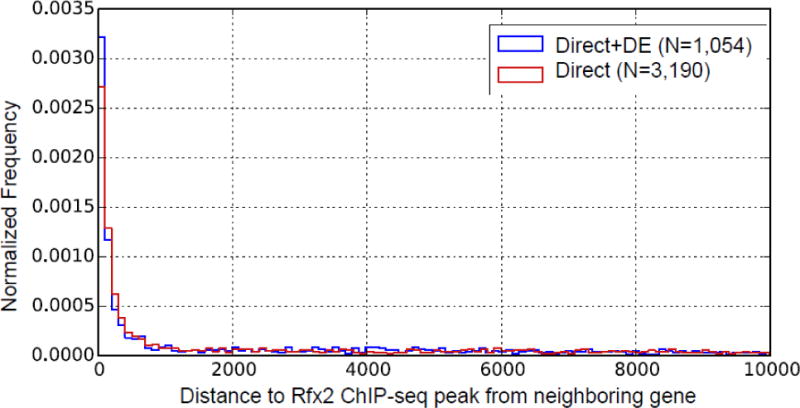
Figure 3. Distance between ChIP-seq-identified Rfx2 binding sites and nearby genes.

“Direct+DE” represents genes that have an Rfx2 binding peak and a significantly differentially expressed pattern in the Rfx2 knockdown condition. “Direct” represents genes that have an Rfx2 binding peak but lack significant differential expression in Rfx2 knockdown. In both cases, however, most peaks are located less than 1,000 bp away from annotated genes.
