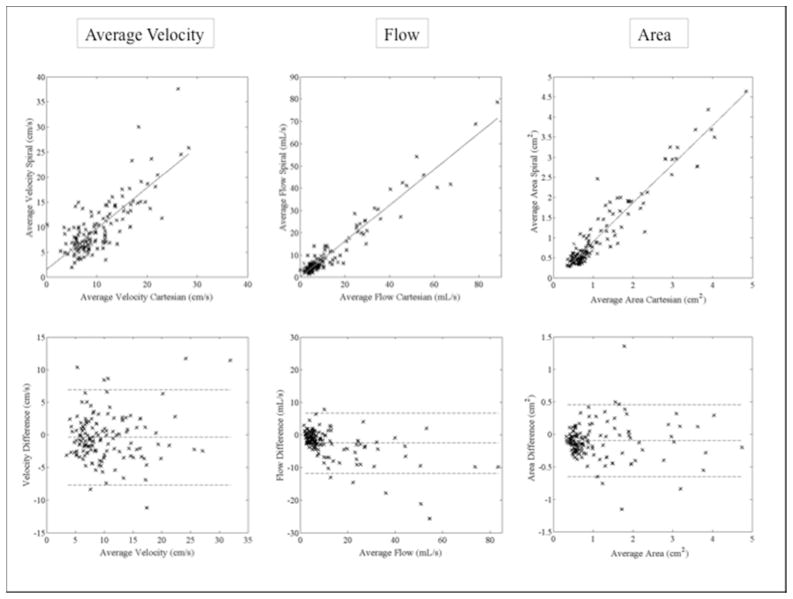
Figure 3.
Correlation (top row) and Bland-Altman plots (bottom row) comparing flow parameters in 136 abdominal vessels measured in 10 subjects using spiral and Cartesian 4D flow. For each subject, all abdominal vessels that were successfully segmented were included in the analysis. Bland Altman limits of agreement are given in Table 2.

