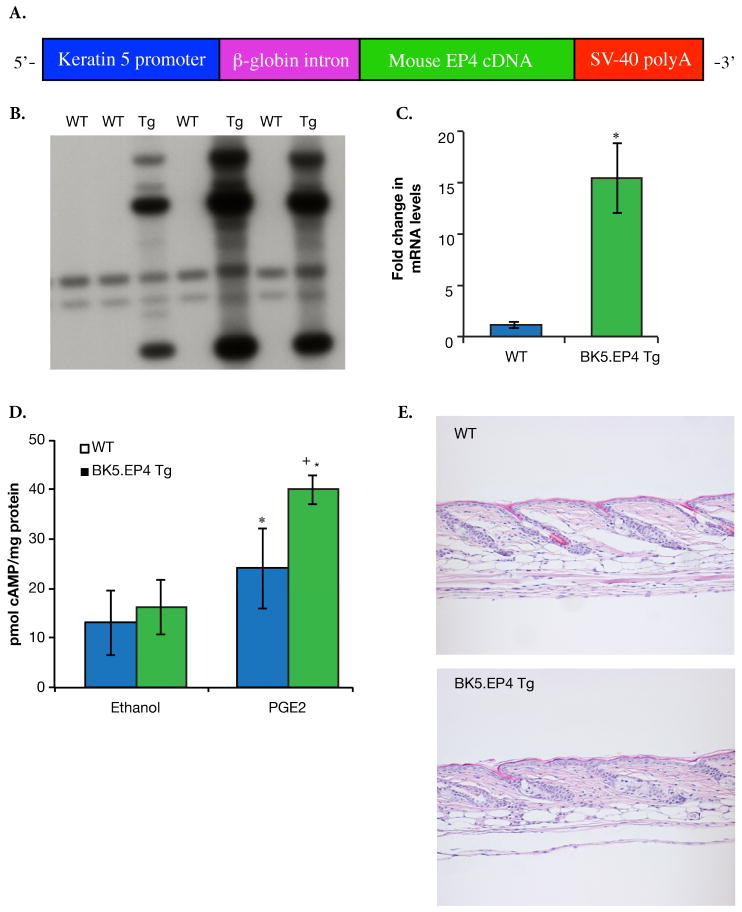
Figure 1. Expression of the EP4 transgene.
A. Diagram of the bovine keratin 5 EP4 (BK5.EP4) construct. B. Southern blot showing integration of the BK5.EP4 construct. C. Increased EP4 mRNA levels in line 9 BK5.EP4 transgenic mice (n=3; bars ± SD) (p<0.01). D. Increased cAMP levels after vehicle or 30 μg PGE2 treatment (1 h) in vivo (n=5 per group ± SD (WT PGE2 v. WT EtOH, p<0.05; BK5.EP4 PGE2 v. WT PGE2, p<0.005; BK5.EP4 PGE2 v. BK5.EP4 EtOH, p<0.0001), assayed as described in Methods and Materials. E. Histology of representative H&E stained sections of skins from WT (top) and line 9 BK5.EP4 mice (bottom).

