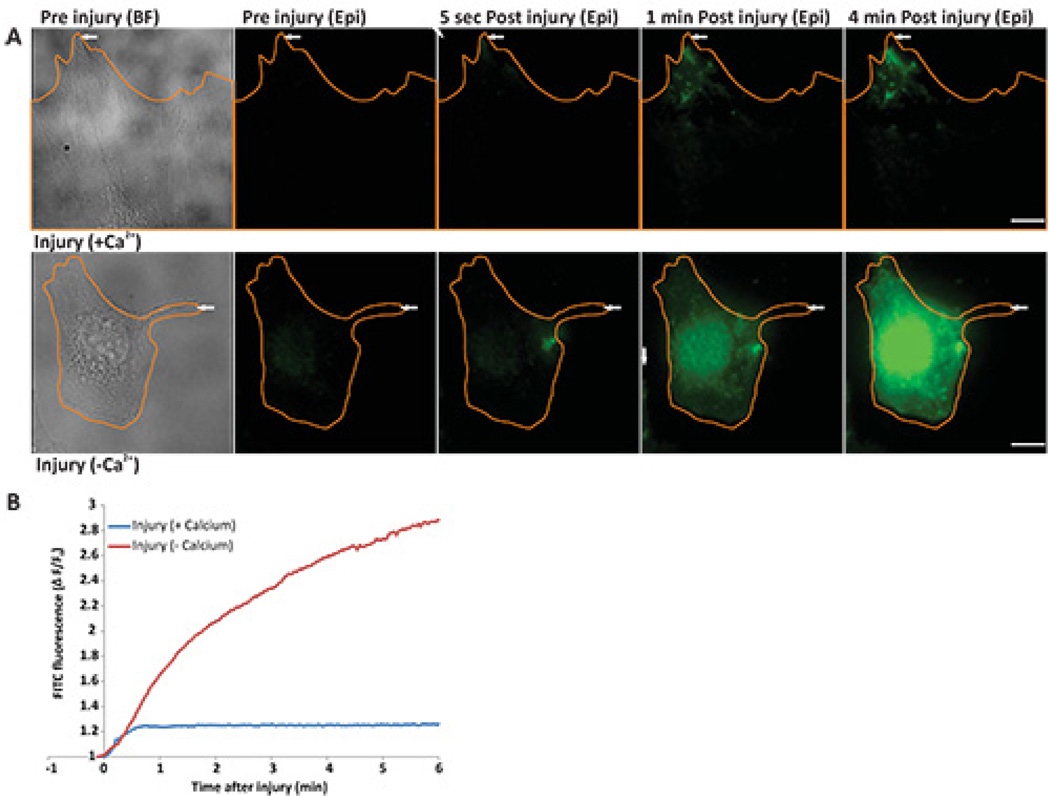
Figure 2. Real time imaging of cell membrane repair in response to laser injury.
(A) Image of cells (outlined in orange) before injury [left panel - bright field (BF) and epifluorescence (epi)], 5 sec, 1 min, and 4 min after injury. The site of injury is indicated by a white arrow. Upper panel shows a cell injured in the presence of calcium and lower panel shows a cell injured in the absence of calcium. (B) Graph showing the change in FM dye staining (ΔF/F0) of the cells in panel A injured in the presence of calcium (blue) or in the absence of calcium (red). The region where FM dye enters and hence fluorescence labeling increased was used for the quantification of the fluorescence intensity. Scale bar = 10 µm).

