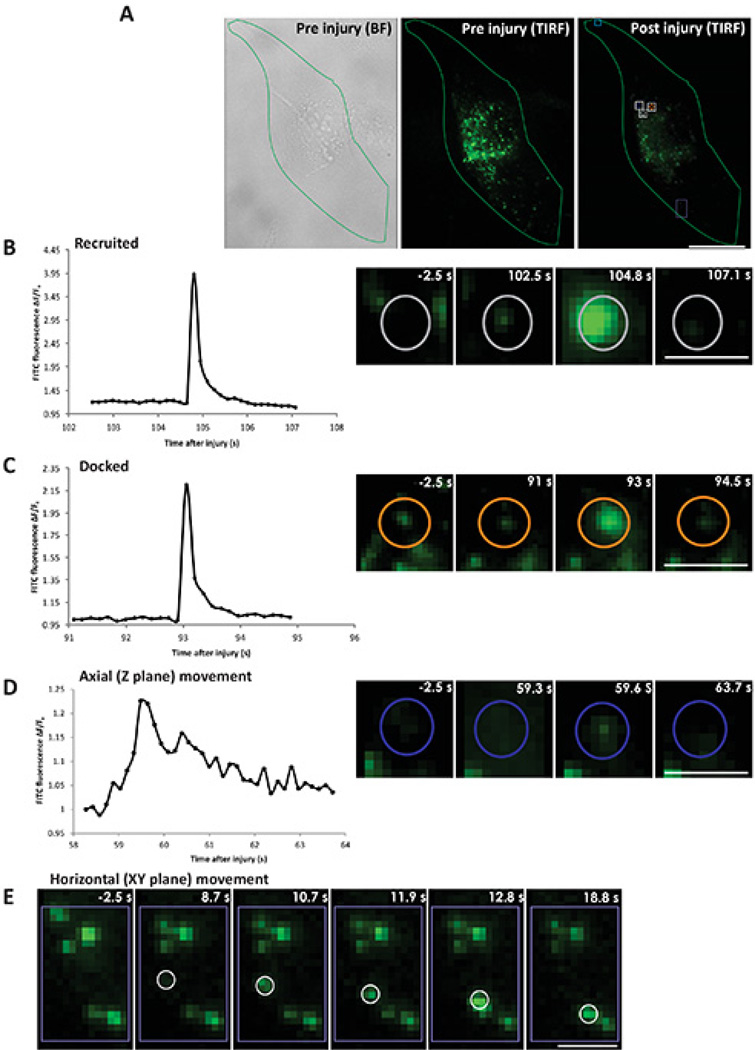
Figure 4. Real time imaging of lysosomal exocytosis in response to laser injury.
Cells with FITC dextran labeled lysosomes were injured by a pulsed laser in presence of calcium. (A) The boundary of the cell that was injured is outlined (in green): left panel - bright field before injury, middle panel - TIRF before injury and right panel - TIRF 105 s after injury. The site of injury is marked by the cyan box and the representative area indicated by white/purple boxes and colored circles within are zoomed in panels B–E. The color of the vesicle in the whole cell image (gray, orange and blue) corresponds to the color in the zoomed in images of individual lysosomes. (B) Left panel shows a plot for the ΔF/F0 value for the FITC fluorescence of a vesicle recruited after injury. Right panel shows snapshots of the vesicle before injury (−2.5 s), prefusion (102.5 s), fusion (104.8 s) and postfusion (107.1 s). (C) Left panel shows a plot for the ΔF/F0 value for the FITC fluorescence of a vesicle docked prior to injury. Right panel shows snapshots of the vesicle before injury (−2.5 s), prefusion (91 s), fusion (93 s) and postfusion (94.5 s). (D) Left panel shows a plot for the ΔF/F0 value for the FITC fluorescence of a vesicle moving axially (towards and away from the cell membrane). Right panel shows snapshots of the vesicle before injury (−2.5 s), and after injury at different position near the membrane at 59.3, 59.6 and 63.7 s. (E) Snapshots of the vesicle that moved horizontally along the cell membrane at various positions before injury (−2.5 s) and after injury at (8.7, 10.7, 11.9, 12.8 and 18.8 s). Scale bar (A=10 µm, B, C, D, E=1 µm).

