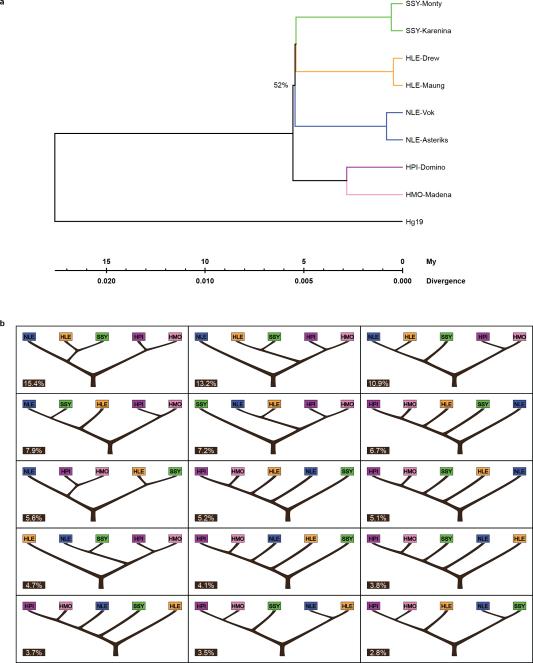
Extended Data Figure 5. Analysis of the phylogenetic relationships between gibbon genera.
a, Neighbor-joining trees for gibbons using non-genic loci. b, UPGMA trees for 100 kbp nonoverlapping sliding windows moving along the gibbon genome reporting the top 15 topologies (see also Supplementary Table ST8.3). The percentage of total support for each topology is given within each subpanel.

