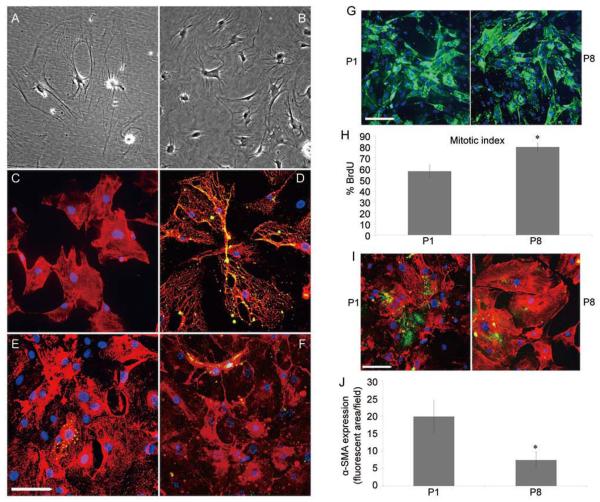
Fig. 1.
Characterization of NG2+ cells at low (P1) and high (P8) passage numbers. Enriched NG2+ cells were isolated on a Percoll gradient. A and b Phase-contrast images of an early culture of mouse adult spinal cord NG2+ cells (A) and a confluent monolayer of mouse adult spinal cord passage 2 NG2+ cells (b). Note that the cultures from the early primary to subsequent passages show that most cells have a largely rhomboid morphology more reflective of pericytes than OPCs. C: The NG2+ cells were relatively homogenous with limited contamination from other cell types. D–F: Dual-immunofluorescence staining of NG2+ cells with PDGFR-β (D), VWF (E) and GFAP (F) shows only a small fraction of the population expressed markers of endothelial cells (E) or astrocytes (F). G: cell cultures from P1 and P8 stained with immunofluorescent antibodies against NG2 and the differentiation marker α-SMA. The morphology of the NG2+ cells was similar in P1 and P8. H: comparison of the rates of proliferation in P1 and P8 NG2+ cells using brdU incorporation demonstrated a significant increase in the proliferation of late-passage cells. All points represent the mean ± SEM of 3 experiments, *P <0.05. I: The expression of α-SMA by NG2+ cells decreased with passage number. While P1 cells expressed low but detectable levels of a-SMA, this decreased significantly at P8. J: Quantification of α-SMA expression by fluorescent imaging using Image J. Note that P1 NG2+ cells expressed very low levels of α-SMA, that decreased with further passages. *P <0.05 for P1 versus P8. Mean ± SEM of duplicate preparations from three independent experiments. Scale bars in A–F, G and I, 100 μm.

