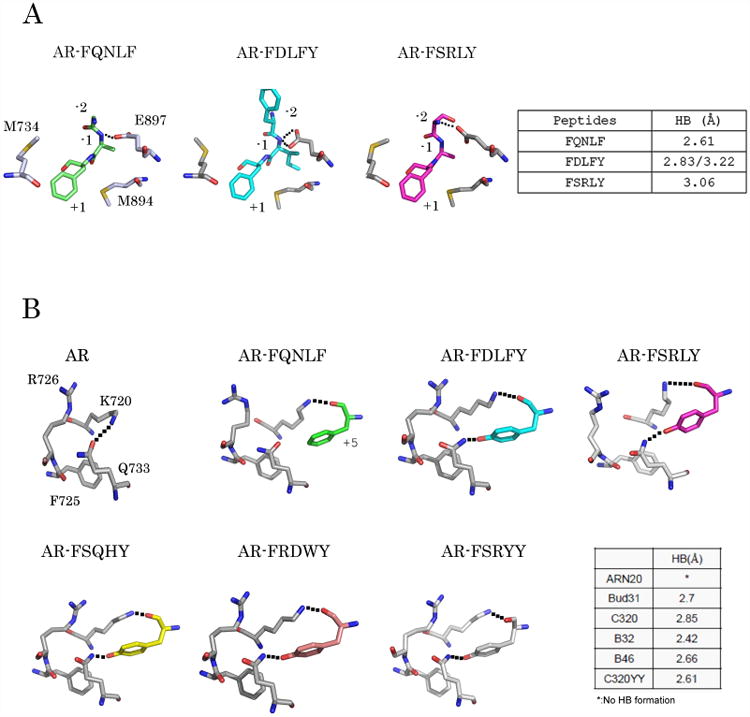
Fig. 2. Interactions in the AF2 site.

Interactions between the peptides and proteins in front-end (A) and back-end (B) areas. Peptides are color-coded as follow: unbound, gray; FQNLF, green, FDLFY, cyan; FSRLY, magenta; FSQHY, yellow, and FSRYY, wheat. Residues are shown as sticks; carbon, nitrogen, and oxygen atoms are shown in gray, blue, and red, respectively. Hydrogen bond contacts are illustrated with black dashed lines. The lengths of the hydrogen bonds are summarized in the tables.
