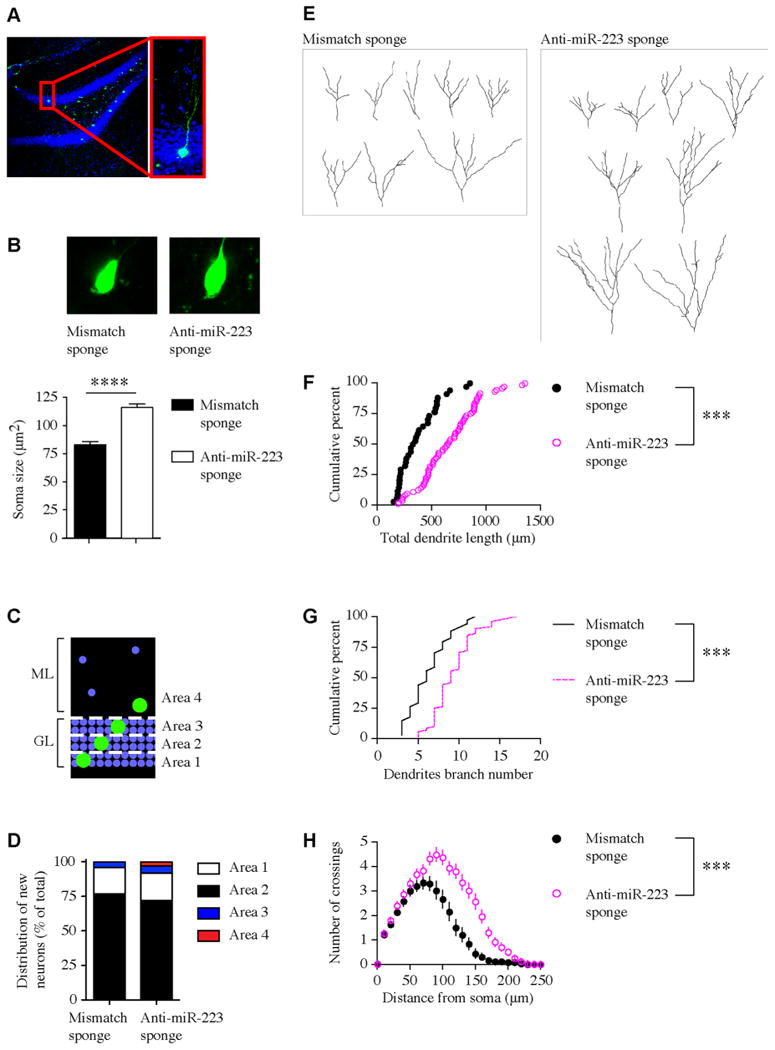
Figure 2. Retrovirus-mediated single-cell soma size, migration and dendritic tree development analysis in dentate gyrus adult-born neurons.

(A) Confocal image of GFP +dentate gyrus granule cell. (B) Upper panel: Confocal image of GFP +dentate gyrus granule cell soma transduced with mismatch sponge or anti-miR-223 sponge retrovirus. Lower panel: Soma size quantification (****p < 0.0001, two-tailed t-test). (C) Diagram of dentate gyrus granule cell layer (GL) and molecular layer (ML) area determination. (D) Distribution of soma localization of GFP + adult born neurons in the dentate gyrus. (B), (D) Mismatch sponge (n = 10) and anti-miR-223 sponge (n = 15). (E) Samples of 2D projection trajectories of the 3D confocal reconstructed images of the dendrites of GFP + neurons at 14 dpi (quantified in panels F-H). (F) Cumulative distribution plot of total dendrite length and (G) Cumulative distribution plot of dendrite branch number of neurons expressing sponge mismatch (n = 10) or anti-miR-223 sponge (n = 15). (***p < 0.001, Kolmogorov-Smirnov test) (H) Sholl analysis (dendritic complexity) of neurons expressing sponge mismatch (n = 10) or anti-miR-223 sponge (n = 15) (mean ±SEM). (***p < 0.001, Two way ANOVA). Data shown are representative of at least 3 independent experiments.
