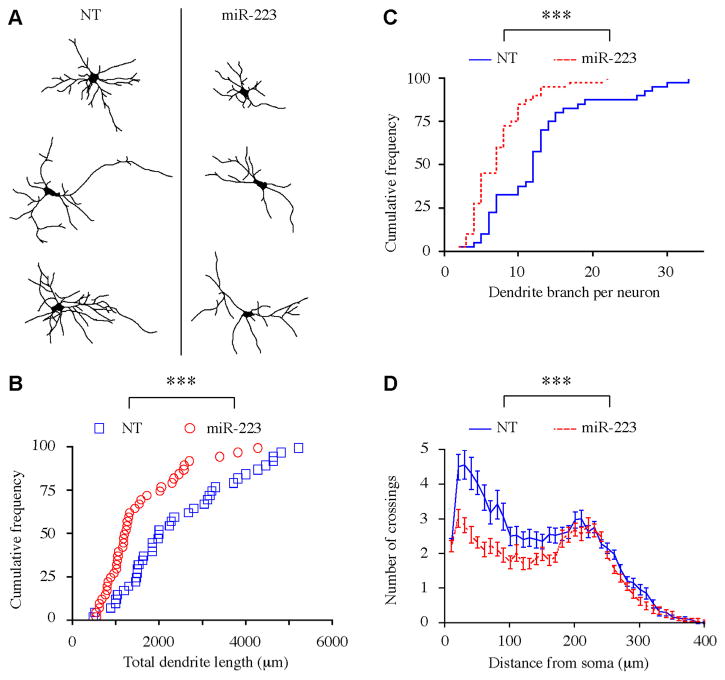
Figure 3. Single-cell dendritic tree development analysis in ESCs-derived human neurons.

(A) Sample 2D projection trajectories of the dendrites of hESCs-derived Tuj-1-positive neurons. (B) Cumulative distribution plot of total dendrite length. (***p < 0.001, Kolmogorov-Smirnov test). (C) Cumulative distribution plot of dendrite branch number. (***p < 0.001, Kolmogorov-Smirnov test). (D) Sholl analysis of neurons dendrite complexity (***p < 0.001, Two way ANOVA). Data replicated 3 independent times. In each replicate; (NT) (n = 40), miR-223 (n = 40).
