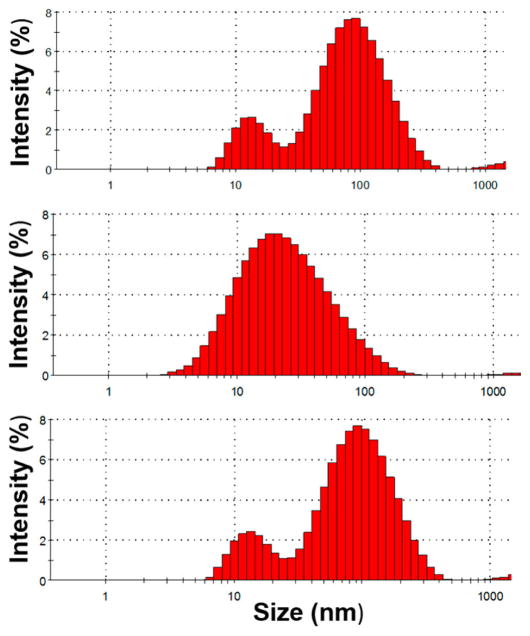
Figure 4.
Histogram showing hydrodynamic size distribution of 5 nm AuNPs at 4, 12, and 24 h time points from top to bottom. A highly concentrated AuNP solution was exposed to serum proteins at 37 °C and continuously measured for 24 h. Data shows an uneven, inconsistent (4 h, 54 nm; 12 h, 18 nm; 24 h, 57 nm), and broad size distribution.

