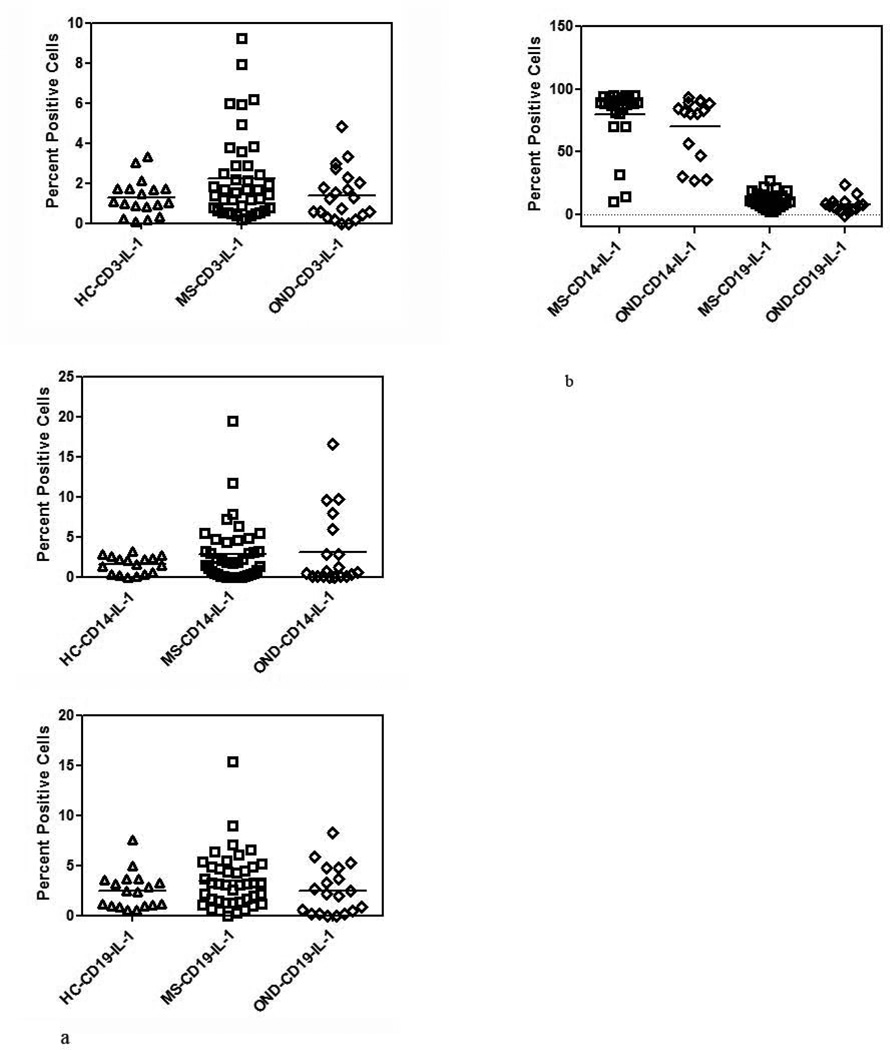
Figure 3. IL-1β expression in MS.
(a) Constitutive expression of IL-1β in MS, HC and OND controls in CD3+, CD14+ and CD19+ cells determined by intracellular cytokine staining as in Figure 1.
(b) LPS induced IL-1 β expression in CD14 and CD19 subset in MS, HC and OND controls performed as in Figure 2b.
Mean values are shown as horizontal bars; there was no statistical difference in either the induced or constitutive levels of IL-1β between MS and controls.

