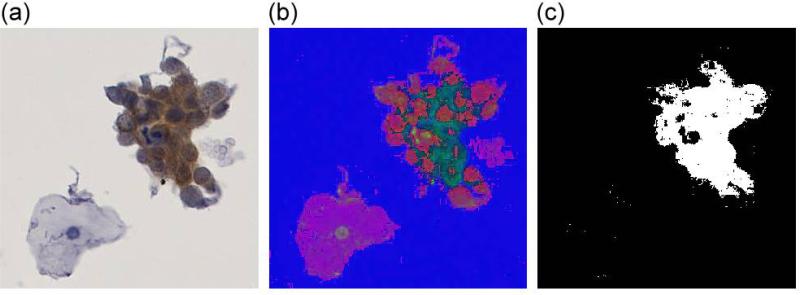
Figure 6. Separation of p16 stained cells by HSV color space transformation.
(a) Original image of a p16 stained cell cluster, (b) visualization of the same cluster in HSV color space (here displayed by interpreting the HSV values as RGB values), (c), applying a threshold in the HSV color space displays p16 stained components of the cluster.

