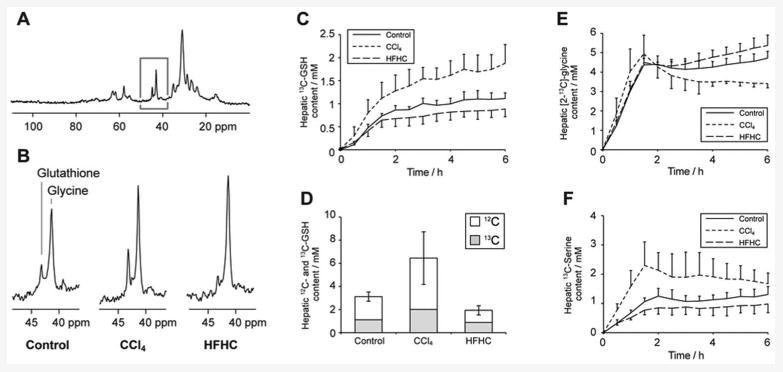
Figure 3.

Preclinical study 13C MR data. A: Representative hepatic 13C spectrum acquired after 6h of [2-13C]-glycine infusion. B: Regions of the 13C spectrum showing resonances from [2-13C]-glycine and 13C-labelled glutathione from rats in each of the three study groups. C: Timecourse of hepatic 13C-labelled glutathione concentration in the experimental groups. D: Mean concentrations of 13C-labelled and total glutathione in the experimental groups at the end of the 6.5h experiment. E & F: Timecourses of hepatic [2-13C]-glycine and [2-13C]-serine concentration in the experimental groups.
