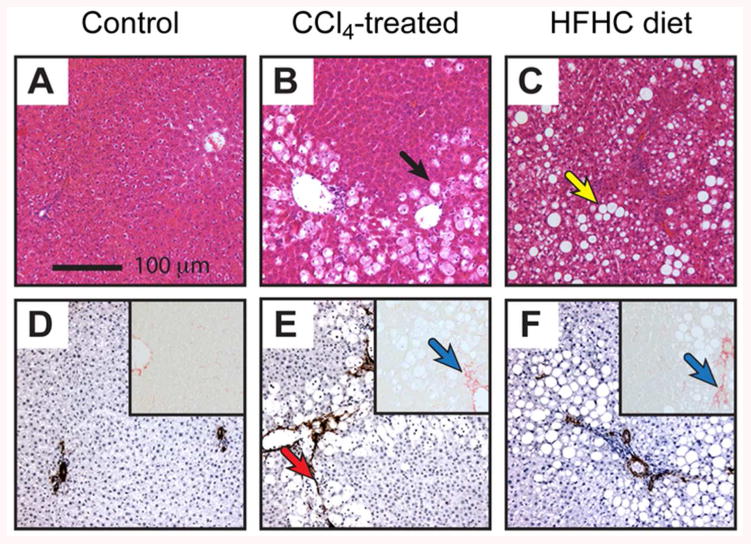
Figure 4.

Histological sections of rat liver from the preclinical study groups. A-C: H&E stained sections. D-F: α-SMA stained sections and Sirius Red stained sections (inset). Representative photomicrographs at x100 magnification of a minimum of n=3 rats per group. Black arrow indicates damaged hepatocytes, yellow arrow indicates fat deposition, red arrow indicates α-SMA staining of myofibroblasts, blue arrows indicate collagen deposition.
