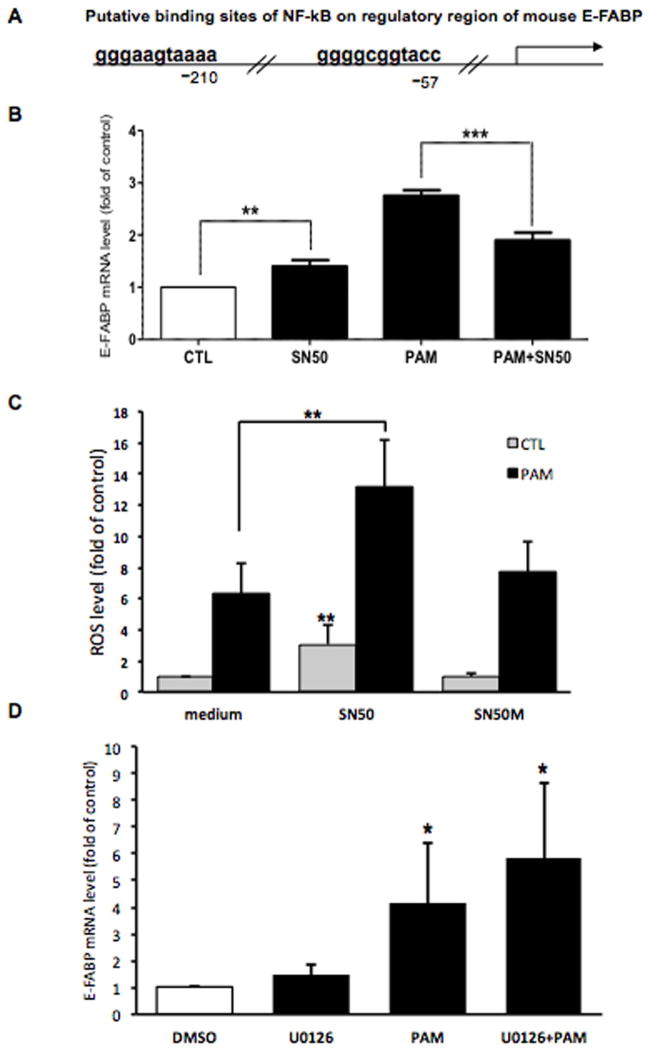
Figure 4. NF-κB inhibitor affects PAM-LTx-induced E-FABP expression and ROS accumulation in NGFDPC12 cells.
(A) The putative binding sites of NF-kB on regulatory region of mouse E-FABP predicted by PROMO program (Farre et al. 2003). (B) Cells were treated with control medium (CTL), NF-kB inhibitor SN50 at 50μg/ml in control medium (SN50), 300 μM PAM (PAM) or PAM together with SN50 (PAM+SN50) for 12 hrs and E-FABP mRNA levels were determined by real-time RT-PCR. (C) Cells were treated with control medium, SN50 or control peptide SN50M with or without 300 μM PAM for 18 hrs and ROS level was measured with H2DCFDA method. (D) Cells were treated with 20 μM of U0126 or control medium with 0.1% DMSO with or without 300 μM PAM for 12 hrs and E-FABP mRNA levels were determined by real-time RT-PCR. The data represent mean ± SEM of three independent experiments. Significance symbols: *=p < 0.05, **=p<0.01 and ***=p<0.001. Significance symbols are shown above bars when compared to control group and are shown above lines when compared between two linked groups.

