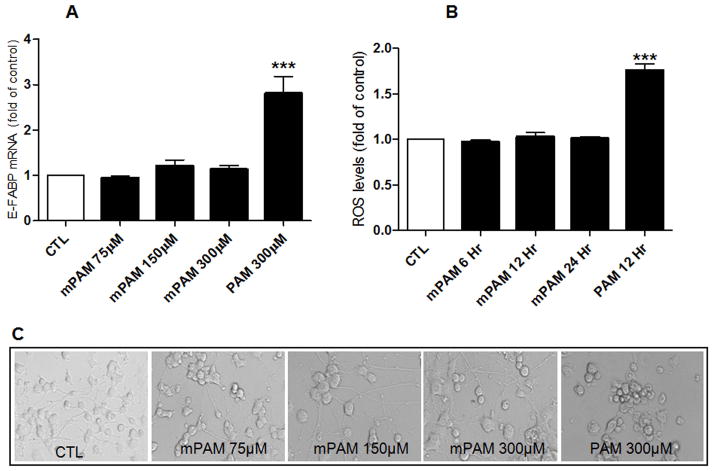
Figure 5. Non-metabolized PAM, methyl palmitic acid (mPAM), does not cause lipotoxicity in NGFDPC12 cells.
(A) Cells were treated with control medium (CTL), 300 μM PAM or mPAM at the concentration of 75 μM, 150 μM or 300 μM for 12 hrs. Relative E-FABP mRNA levels were determined by real-time RT-PCR. (B) Cells were treated with control medium (CTL), 300 μM PAM for 12 hrs or 300 μM mPAM for 6, 12, and 24 hrs and ROS level was measured with H2DCFDA method. The data represent mean ± SEM of three independent experiments. Significance symbols: ***=p<0.001 (compared to control group). (C) Representative morphological photographs of NGFDPC12 cells 48 hrs after being treated as in (A).

