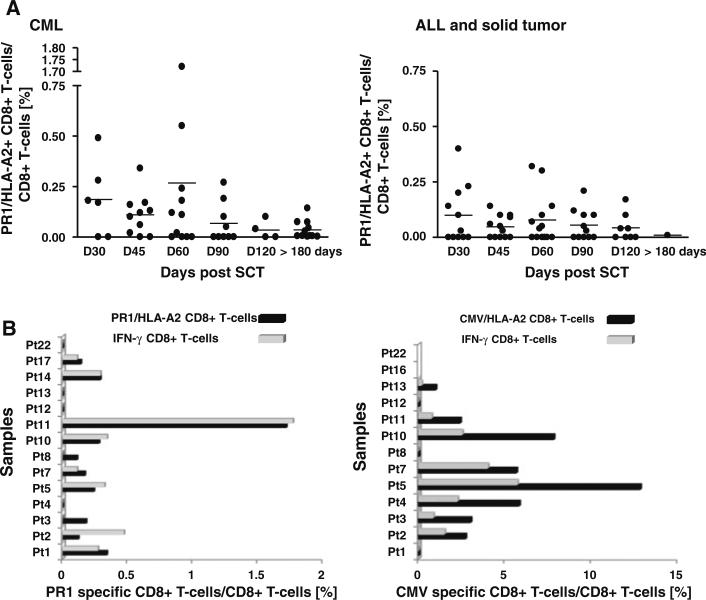
Fig. 1.
CD8+ T-cell responses to PR1 in patients with CML, ALL, and solid tumor after SCT. a Comparison of frequencies of PR1/HLA-A*0201+ CD8+ T cells in patients with CML, ALL, and solid tumor after SCT. The values represent the PR1/ HLA-A*0201+ CD8+ T-cell response for each patient at specific time points after SCT. Bars represent means. b Frequencies of PR1-specific CD8+ T cells by tetramer analysis (black bar) and PR1-specific IFN-γ-producing CD8+ T cells (gray bar)

