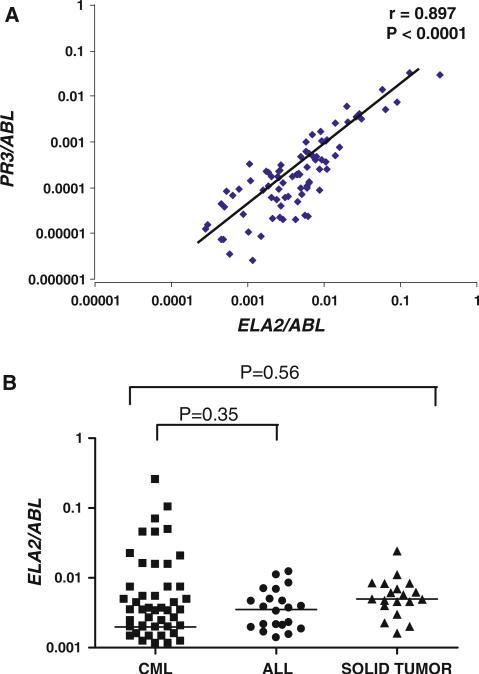
Fig. 2.
PR3 and ELA2 gene expression in the peripheral blood of patients with CML, ALL, and solid tumor after SCT. a Correlation between PR3 and ELA2 expression in PB samples from the patients with CML, ALL, and solid tumor. b ELA2 gene expression in peripheral blood samples from the patients with CML, ALL, and solid tumor after SCT. Bars represent medians. Values of genes represent the RQ-PCR expression as a ratio of the gene of interest to the ABL control gene

